MER vs ROAS: Which Efficiency Metric Should Actually Steer Your Budget?

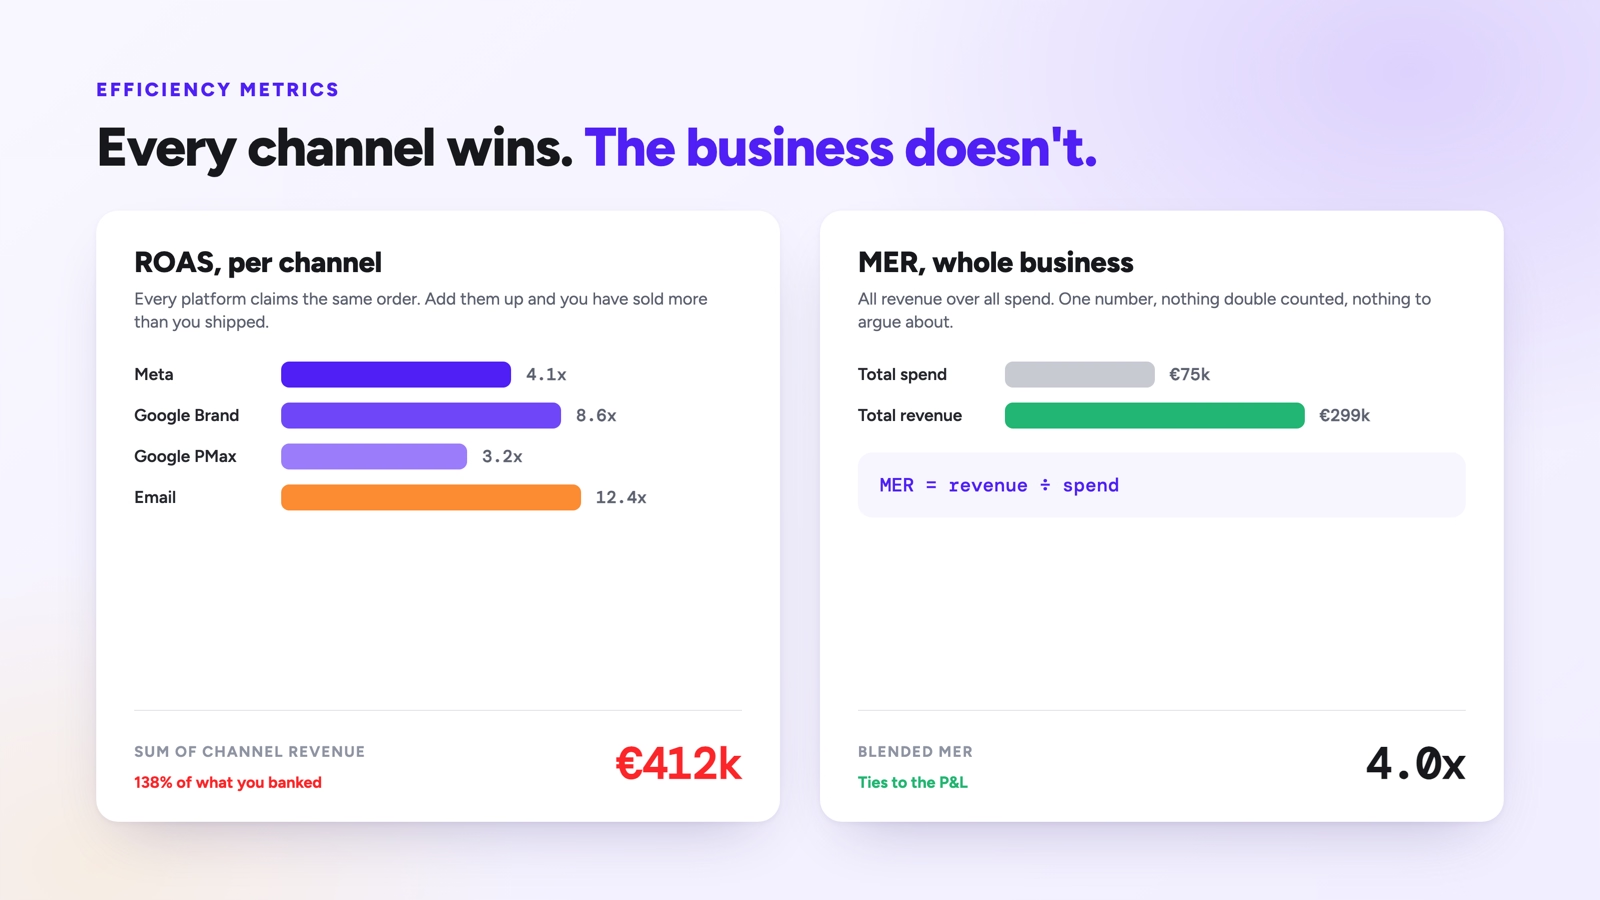
A brand hits a 4.0 ROAS across every campaign in Meta and Google, scales spend by 40 percent, and watches total revenue grow by 12 percent. Nothing in the channel reporting explains the gap. This is the exact situation MER was invented for. MER vs ROAS is not a question of which metric is correct, it is a question of which level of the business you are looking at: MER looks at the whole company, ROAS looks at one channel at a time, and the two disagree in ways that carry real information.
What you will learn
A brand hits a 4.0 ROAS across every campaign in Meta and Google, scales spend by 40 percent, and watches total revenue grow by 12 percent. Nothing in the channel reporting explains the gap. This is the exact situation MER was invented for. MER vs ROAS is not a question of which metric is correct, it is a question of which level of the business you are looking at: MER looks at the whole company, ROAS looks at one channel at a time, and the two disagree in ways that carry real information.
Two Views of the Same Spend
MER, marketing efficiency ratio, is calculated at the business level and ignores attribution entirely.
MER = total revenue / total marketing spend
Total revenue means everything the shop sold in the period, from every source, including organic, direct, email, and returning customers. Total marketing spend means everything you paid to acquire demand, usually all paid media, and sometimes agency and production costs as well. Some teams invert it and report the same relationship as a percentage of revenue spent on marketing, which is the same information with the fraction flipped.
ROAS, return on ad spend, is calculated per channel, campaign, or ad set.
ROAS = revenue attributed to that unit / spend on that unit
The essential difference is attribution. ROAS requires a decision about which orders belong to which touchpoint. MER refuses to make that decision. It simply asks how much revenue the business produced for every euro it put into marketing.
That refusal is MER's strength and its weakness in equal measure. It cannot be gamed by attribution windows, view through settings, or platform self reporting, because it never looks at them. It also cannot tell you which channel to cut, because it does not know that channels exist.
Reading the Two Together
The interesting signal comes from the relationship between them over time.
| Pattern | What it usually means |
|---|---|
| ROAS stable, MER falling | Channel reporting is claiming credit for revenue that would have happened anyway, or spend is cannibalising organic |
| ROAS falling, MER stable | Attribution is shifting between channels, but total efficiency is intact |
| Both falling | Genuine efficiency decline, usually saturation or rising competition |
| Both rising | Real improvement, or a seasonal demand spike inflating both |
The first row is the one that catches brands out. If every campaign holds its ROAS while you scale, but MER deteriorates, the additional spend is buying orders that were already coming. That is the classic signature of over investment in retargeting and branded search.
Where Each Metric Belongs
MER is the metric a founder or CFO should look at first, because it maps directly onto the profit and loss statement. There is no reconciliation step and no methodology to defend. If MER was 4.2 last quarter and 3.6 this quarter, the business is converting marketing money into revenue less efficiently, full stop. For monthly board reporting and for cash planning, that clarity is worth more than channel level precision.
MER is also the honest metric during any period when tracking quality is in doubt. Brands operating under strict consent regimes in Germany, Austria, and Switzerland regularly lose visibility on a meaningful share of journeys. Channel level ROAS degrades under those conditions. MER does not, because it never depended on tracking a single user.
ROAS is the metric a performance marketer needs, because MER offers no instructions. When MER drops, someone has to decide which campaign to pause and which to scale, and that requires channel and campaign level attribution. A media buyer cannot act on a single business wide ratio.
The situations where the split matters most:
- Scaling decisions. Adding budget to a channel with strong ROAS while MER stays flat is the clearest evidence that the channel ROAS is not incremental.
- Testing new channels. A new channel starts with poor ROAS and a small budget. MER will not move. Judge it on ROAS trajectory and holdout tests, not on business level ratios.
- Seasonal peaks. Black Friday inflates MER because demand arrives regardless of spend. Comparing November MER to March MER is not a like for like comparison.
- Discount periods. A promotion lifts revenue and therefore MER, while margin per order collapses. Neither MER nor ROAS notices, because both use revenue rather than profit.
That last point is worth sitting with. MER and ROAS are both revenue metrics. A brand can improve both simultaneously by discounting its way to volume and end the quarter with less money in the bank. Pairing either metric with contribution margin, or moving to POAS, is what closes that hole.
Choosing, Combining, and Avoiding the Usual Traps
A practical setup uses both, with clearly assigned jobs:
- Use MER as the constraint. Set a target MER that clears your cost base, and treat it as the ceiling on total spend. It answers "can we afford this."
- Use ROAS as the allocator. Within the budget MER permits, use attributed channel performance to decide the split. It answers "where does it go."
- Never mix them in one comparison. A channel ROAS of 3.0 and a business MER of 3.0 are not the same number and cannot be compared.
- Check the lag. MER is instantaneous by construction. ROAS depends on the attribution window, so a rising ROAS may simply be conversions arriving late from earlier spend.
- Watch the organic share. If organic and direct make up a large share of revenue, MER will look strong even when paid acquisition is inefficient.
The organic share issue is the single biggest source of false comfort in MER. A brand with a large email list and strong repeat purchase carries a lot of revenue that arrives with no marketing cost attached. That revenue sits in the MER numerator and disguises weak new customer acquisition underneath. The fix is to calculate a new customer MER as well, dividing revenue from first time buyers by acquisition spend, which strips out the base and shows what growth actually costs.
The attribution issue is the biggest source of false comfort in ROAS. Platform reported ROAS overlaps across networks and sums to more revenue than the business earned. If your channel ROAS figures cannot be added up and reconciled against shop revenue, then the gap you see against MER is partly a measurement artefact rather than a business signal. An independent attribution layer that assigns each order once makes the two metrics comparable enough to reason about together.
One more common mistake: treating a MER target as fixed across the year. MER moves with product mix, seasonality, promotional calendar, and the ratio of new to returning customers. A target that made sense in a quiet quarter will look like failure in a heavy acquisition push, when you are deliberately spending ahead of revenue.
The Practical Summary
MER and ROAS answer different questions and both are necessary. MER divides total revenue by total marketing spend and gives an attribution free view of whether the business converts marketing money into sales efficiently. ROAS divides attributed revenue by channel spend and gives the granularity you need to actually change something. MER tells you the temperature, ROAS tells you which window is open.
Run both. Set the spend ceiling with MER, allocate underneath it with attributed ROAS, and pay attention when the two diverge, because a stable ROAS alongside a falling MER is the earliest reliable warning that your channel reporting is crediting itself for demand it did not create. Then add margin to the picture, because a business can improve both ratios and still lose money on every order it sells.
FAQ
Is MER better than ROAS?
Neither is better. MER is more reliable because it does not depend on attribution, but it is not actionable on its own. ROAS is actionable but inherits every bias in your measurement. Most teams that pick only one end up either flying blind or optimising toward a number that does not reconcile with reality.
What is a good MER?
It depends on gross margin, repeat rate, and how much of your revenue arrives without marketing cost. Rather than adopting a benchmark, calculate the MER at which your contribution profit covers fixed costs, then set the target above it. For many ecommerce brands that lands somewhere between 3 and 5, but the range is wide enough that the benchmark is close to useless.
Should MER include agency fees, tooling, and salaries?
Include them if you are using MER for company level planning, because those costs are real. Keep a media only version alongside it for comparison against channel ROAS. Just be consistent, since switching definitions mid year makes the trend meaningless.
Why does MER get worse when I scale even though ROAS holds?
Because the incremental spend is reaching people who would have bought anyway. Platform attribution counts those orders, so ROAS holds. The business sees no extra revenue, so MER falls. That divergence is the most useful diagnostic either metric produces.
How do I handle seasonality when comparing MER?
Compare against the same period last year rather than the previous month, and note the promotional calendar next to the number. A MER of 5.0 in a Black Friday week and a MER of 5.0 in February describe very different levels of marketing effectiveness.
Decisions start with trust
14-days for free