How Much of Your Ad Spend Goes to Bots?

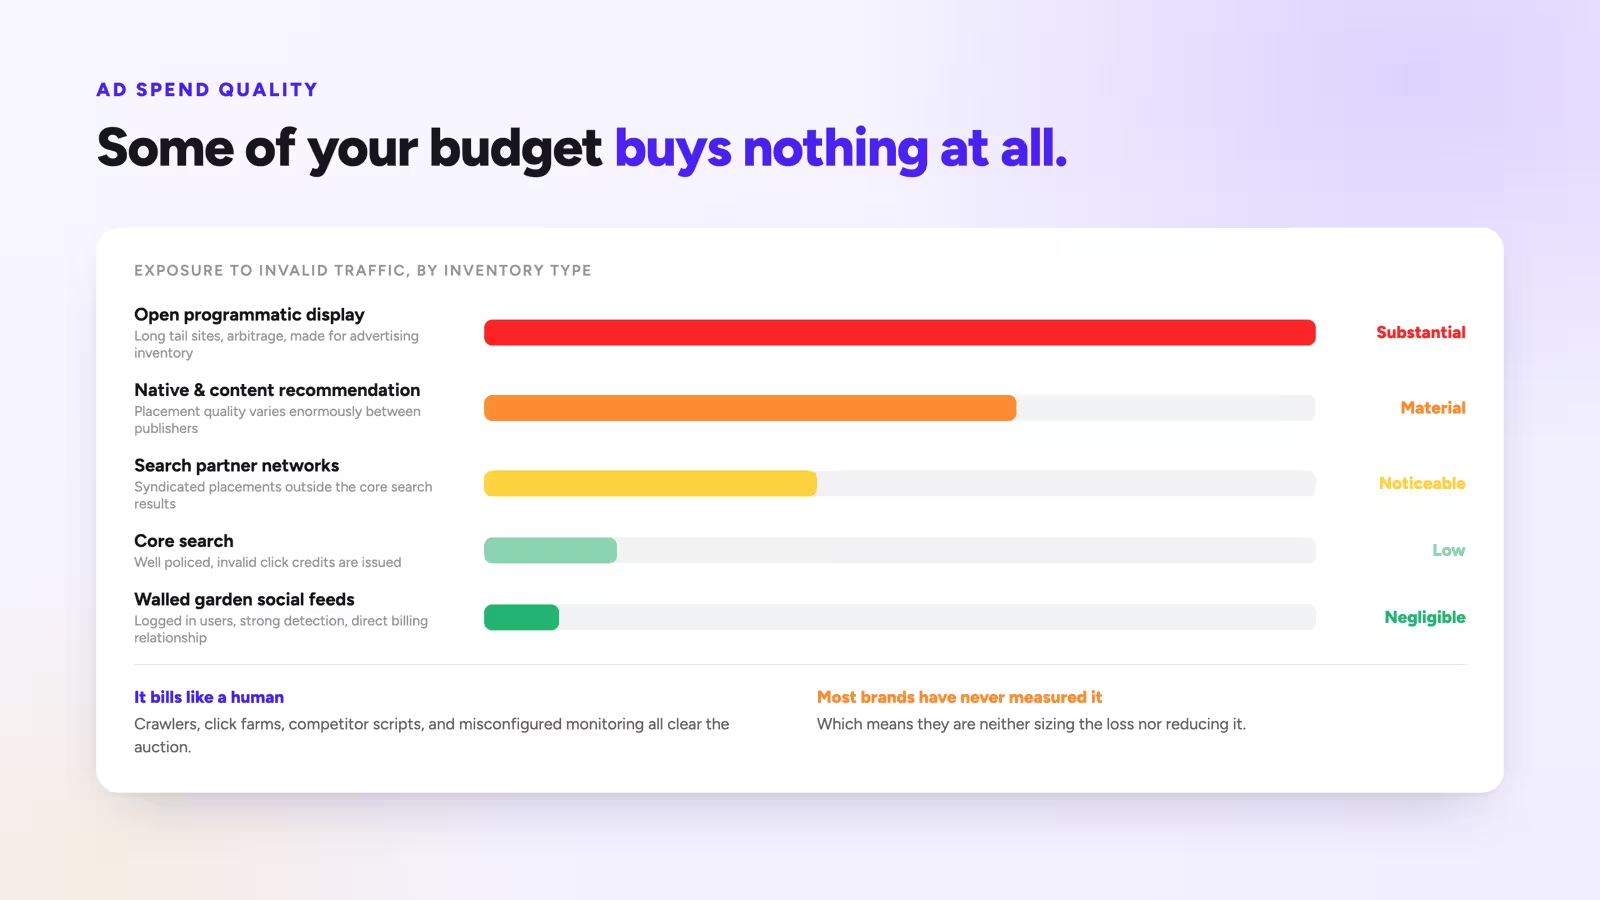
Every advertiser pays for some traffic that was never a person. Automated crawlers, click farms, ad fraud operations, competitor scripts, and misconfigured monitoring tools all generate clicks and impressions that are billed exactly like human ones. The share varies enormously by channel and inventory type, from negligible on well policed walled garden placements to substantial on open programmatic display. Most brands have never measured it, which means they are neither sizing the loss nor reducing it. This article covers how to detect invalid traffic in your own data, how to estimate what it costs you, and which countermeasures are worth the effort.
What you will learn
Every advertiser pays for some traffic that was never a person. Automated crawlers, click farms, ad fraud operations, competitor scripts, and misconfigured monitoring tools all generate clicks and impressions that are billed exactly like human ones. The share varies enormously by channel and inventory type, from negligible on well policed walled garden placements to substantial on open programmatic display. Most brands have never measured it, which means they are neither sizing the loss nor reducing it. This article covers how to detect invalid traffic in your own data, how to estimate what it costs you, and which countermeasures are worth the effort.
What Counts as Invalid Traffic
The category is broader than fraud and worth separating.
General invalid traffic is non malicious automation: search engine crawlers, SEO tools, uptime monitors, preview generators, and accessibility scanners. Most is filtered by the platforms and by analytics known bot lists, but not all of it, and misidentified user agents slip through routinely.
Sophisticated invalid traffic is deliberate: click farms, bot networks generating impressions on low quality inventory, domain spoofing where ad space is sold as belonging to a premium site, and click injection on mobile.
Competitive click activity sits in a grey area. Competitors clicking your search ads to exhaust budget is not automated in the technical sense but is equally worthless to you.
Your own traffic. Internal staff, agency staff, and development environments generate sessions that pollute analytics and occasionally clicks that cost money. This is the easiest category to eliminate and the most commonly overlooked.
Detecting It in Your Own Data
You do not need a specialist tool to get a first estimate. Several signals are visible in standard analytics.
Zero duration sessions with no interaction. A click that produced a session lasting under a second with no scroll and no second page view is very unlikely to be a person who chose to visit. Some share is genuine, from people who clicked accidentally or left immediately, but an unusually high proportion is a signal.
Implausible behavioural uniformity. Real human sessions vary in duration, scroll depth, and page count. Clusters of sessions with near identical behaviour point to automation.
Geographic mismatch. Traffic from countries you do not target and do not ship to, arriving in volume through a paid campaign, is either a targeting misconfiguration or invalid traffic. Both cost money.
Time of day patterns. Human traffic follows a daily curve. Flat traffic through the night, or spikes at precise intervals, indicates automation.
Data centre networks. Traffic originating from hosting provider address ranges rather than consumer internet providers is almost never a genuine customer.
Click to session discrepancy. Platform reported clicks substantially exceeding recorded sessions. Some gap is normal from bounces before page load and parameter stripping, but a large gap can indicate clicks that never produced a real page load at all.
| Signal | How to check | Typical benign level |
|---|---|---|
| Sub second sessions | Session duration distribution | Under 10% of paid sessions |
| Non target geography | Country report filtered to paid | Near zero on geo targeted campaigns |
| Overnight flat traffic | Hourly traffic distribution | Follows a clear daily curve |
| Data centre origins | Network or ISP dimension | Very low single digits |
| Click to session gap | Platform clicks vs tagged sessions | Under roughly 20% |
Sizing the Cost
Once you have an estimate of the invalid share by channel, the cost calculation is direct: multiply invalid share by spend on that channel.
The exercise is worth doing per channel rather than blended, because the variance is large. Walled garden placements on Google Search and Meta feed are comparatively well policed, and the residual invalid share is usually low. Open programmatic display, in app inventory, and audience network placements are where the meaningful losses concentrate.
The second cost is less obvious and often larger. Invalid traffic does not just waste the click cost, it corrupts the optimisation signal. If a share of your traffic never converts because it was never human, then conversion rate per placement, per audience, and per creative is being measured with noise in it. Platform algorithms optimising on that signal learn from corrupted data, and lookalike audiences built on polluted conversion sets are less accurate.
The third cost is reporting distortion. Sessions that never convert drag down conversion rate, which makes campaigns look worse than they are and can trigger the wrong optimisation decisions.
Reducing It
Countermeasures, roughly in order of effort against benefit.
Exclude your own traffic. Filter internal networks and agency addresses from analytics, and add them to campaign exclusions where the platform allows. Trivial to do, immediate benefit, and commonly skipped.
Tighten placement controls. On Google Display and Performance Max, review placement reports and exclude low quality sites and apps. Mobile game inventory in particular generates high click volume with near zero purchase intent. Applying content exclusions and a curated placement list handles most of the display problem.
Turn off audience network placements when they underperform. Meta's audience network and equivalent extended placements consistently show weaker post click behaviour than in feed placements. Check yours specifically rather than assuming.
Use IP exclusion lists on search. Google Ads supports IP exclusions, which handles repeat competitive clicking and known problematic ranges.
Enable platform level invalid traffic filtering. Both major platforms filter automatically and issue credits for detected invalid clicks. Check whether the credits appear on your invoices, since many advertisers never look.
Consider a click fraud tool for high display spend. Specialist tools monitor click patterns and add offending sources to exclusion lists automatically. The economics work when display and programmatic spend is high enough that a few percent of savings exceeds the subscription cost. For brands running mostly search and social, the return is usually thin.
Verify conversions server side. Server side event collection with proper validation makes it harder for fraudulent activity to generate false conversion signals, which protects the optimisation loop even where the click cost cannot be recovered.
The Decision Factors
- Where is your spend? Search and social feed placements need far less attention than open programmatic and in app inventory.
- Have you measured before acting? Buying a fraud tool without knowing your invalid share is spending against an unquantified problem.
- Are the easy exclusions done? Internal traffic, non target geographies, and obvious low quality placements cover most of the recoverable loss for most brands.
- Is the optimisation signal protected? Corrupted conversion data costs more over time than the wasted clicks.
- Are platform credits being checked? They arrive automatically and are frequently ignored.
The measurement first point is worth stressing because the market around this topic encourages the opposite. Vendor material tends to quote high industry wide invalid traffic percentages, and those figures are usually drawn from open programmatic environments where the problem is genuinely severe. A brand running 90 percent of its budget through Google Search and Meta feed does not have the same exposure, and applying a headline industry figure to that budget produces a scary number that does not describe its situation. Spend an hour on the detection signals above before spending money on a solution.
The optimisation signal point is the one that justifies acting even when the direct click waste is modest. A campaign whose conversion data includes a share of traffic that could never convert is teaching the platform algorithm an inaccurate picture of who converts. That effect compounds, and it is not recovered by a click credit.
Summary
Some share of every ad budget reaches automated traffic rather than people, and the share varies from negligible on well policed feed and search placements to substantial on open programmatic and in app inventory. Detect it in your own analytics through sub second sessions, non target geographies, flat overnight traffic, data centre network origins, and gaps between platform reported clicks and recorded sessions.
Start with the cheap fixes: exclude internal traffic, tighten placement controls, review extended placement performance, and check whether platform invalid traffic credits are appearing on your invoices. Reserve specialist tooling for accounts with high display and programmatic spend where the recoverable amount justifies the cost. And measure your own exposure before acting on industry wide statistics, because headline fraud percentages are drawn from the worst inventory and will not describe an account running mostly search and social.
FAQ
What percentage of ad clicks are bots?
It varies too widely by channel for a single figure to be useful. Walled garden search and feed placements are comparatively well policed, while open programmatic and in app inventory can be substantially worse. Measure your own accounts using the detection signals rather than applying a published industry average.
How can I detect bot traffic without a specialist tool?
Look at session duration distribution for sub second sessions, country reports for traffic outside your targeting, hourly traffic patterns for flat overnight activity, and network dimensions for data centre origins. Also compare platform reported clicks against sessions carrying your campaign parameters.
Do ad platforms refund invalid clicks?
Both major platforms filter invalid traffic automatically and issue credits for what they detect, typically shown on the invoice. Many advertisers never check whether these credits appear, and reviewing them is a five minute exercise.
Is a click fraud prevention tool worth it?
It depends on where your budget sits. For accounts with substantial display and programmatic spend, the savings can comfortably exceed the subscription. For accounts running mostly Google Search and Meta feed, the recoverable amount is usually too small to justify it. Measure first.
Does bot traffic affect more than just wasted spend?
Yes, and often more expensively. Invalid traffic that never converts corrupts the conversion signal that platform algorithms optimise on and that lookalike audiences are built from. That degradation compounds over time and is not recovered by any click credit.
Decisions start with trust
14-days for free