Hook Rate Explained: How to Measure the First Three Seconds of a Video Ad

Most video ads lose the argument in the first three seconds. Not because the offer is wrong or the product is unappealing, but because nobody stayed long enough to find out. Hook rate is the metric that isolates that moment. It measures the share of people who stopped scrolling long enough to register your ad, separating the question of whether your opening earns attention from the question of whether the rest of the ad deserves it. For any brand running video creative at volume, it is the single most actionable diagnostic in the creative reporting suite.
What you will learn
Most video ads lose the argument in the first three seconds. Not because the offer is wrong or the product is unappealing, but because nobody stayed long enough to find out. Hook rate is the metric that isolates that moment. It measures the share of people who stopped scrolling long enough to register your ad, separating the question of whether your opening earns attention from the question of whether the rest of the ad deserves it. For any brand running video creative at volume, it is the single most actionable diagnostic in the creative reporting suite.
What Hook Rate Measures and How to Calculate It
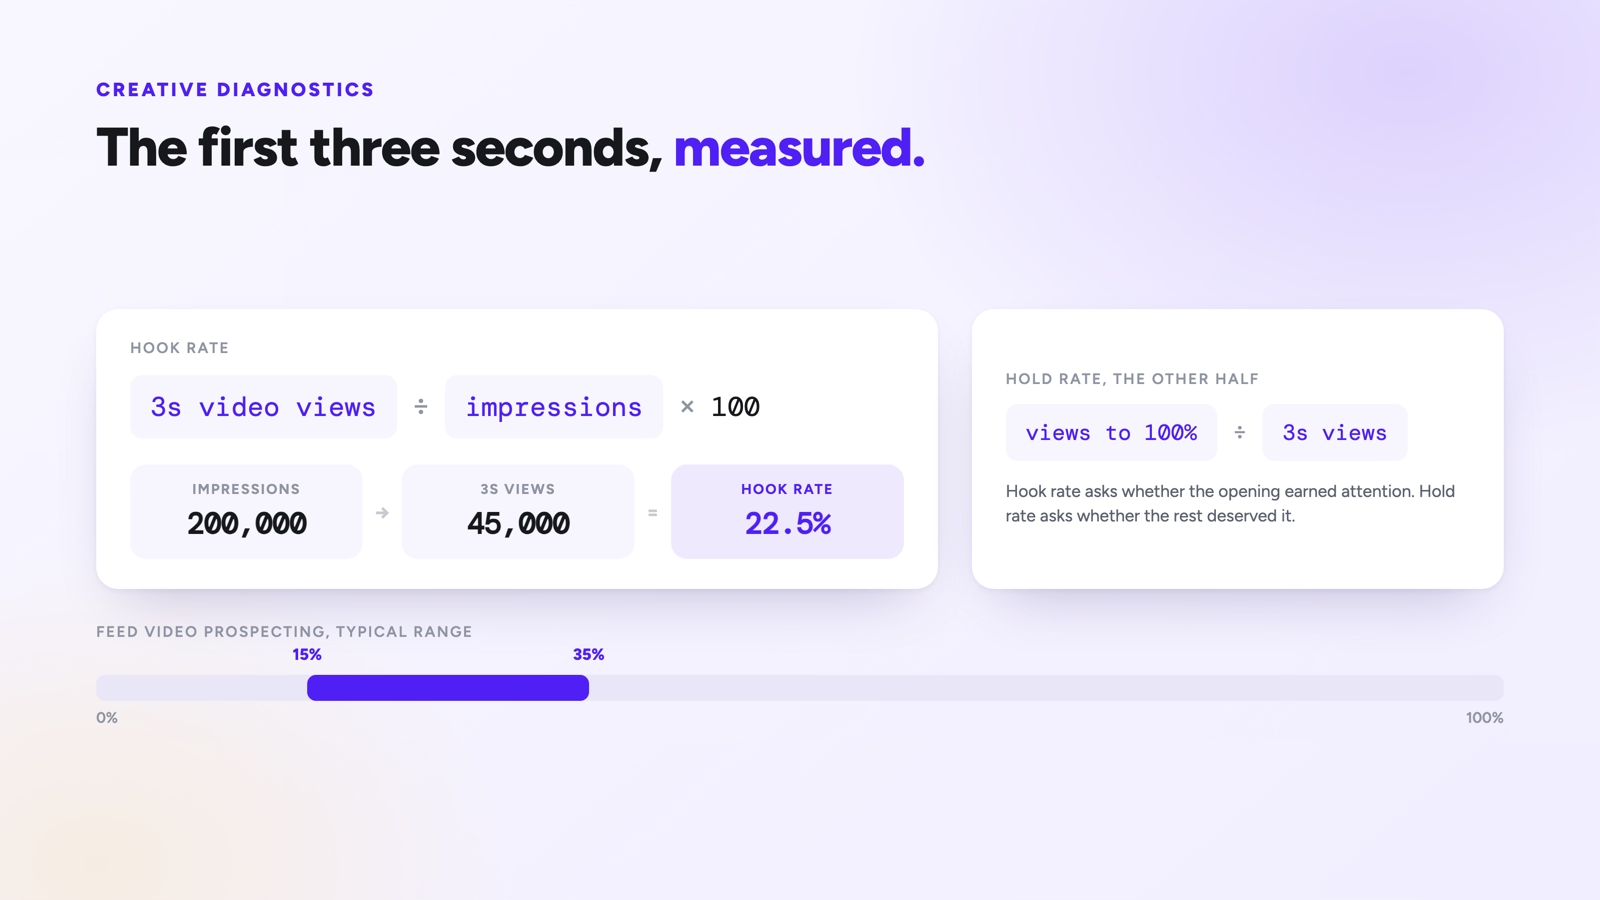
Hook rate is the percentage of impressions that resulted in a three second video view.
Hook rate = (3 second video views / impressions) x 100
Some teams use reach in the denominator instead of impressions, which produces a person level rather than exposure level figure. Both are defensible, but they are not comparable, so pick one and use it consistently across every report.
Serve a video 200,000 times, record 45,000 three second views, and the hook rate is 22.5 percent. Roughly one in four people who scrolled past stopped for long enough to take in the opening frame and the first beat of the message.
The three second definition comes from Meta's video view metric and has become the de facto standard across TikTok, Reels, and Shorts style placements. It is somewhat arbitrary, and platforms have shifted their default video metrics over time, but the value is comparative rather than absolute. What matters is whether creative A holds attention better than creative B under identical delivery conditions.
Hook Rate Versus Hold Rate
Hook rate has a natural companion that measures the second half of the problem.
Hold rate = (video views to 100% / 3 second video views) x 100
Hold rate measures how many of the people who stopped actually stayed to the end. Together the two split video performance into two independent questions.
| Hook rate | Hold rate | Diagnosis |
|---|---|---|
| High | High | Strong creative overall, scale it |
| High | Low | The opening promises something the ad does not deliver |
| Low | High | The content works but the first frame is invisible, re edit the opening |
| Low | Low | Concept problem, not an editing problem |
The third row is the most valuable finding this pair produces. A video with a low hook rate and a strong hold rate is a good ad with a bad first three seconds. Recutting the opening, moving the most arresting moment to frame one, or adding a pattern interrupt can transform its performance without changing the concept, the offer, or the shoot.
Benchmarks Worth Anything
Absolute hook rate numbers vary enormously by placement, audience, and format. Feed placements produce different rates from Stories, and cold prospecting produces different rates from retargeting. Rather than importing a benchmark, build your own: calculate hook rate across every video you have run in the last six months, take the median, and treat that as your baseline. Anything meaningfully above it is a candidate for scaling and anything meaningfully below it is a candidate for a recut.
As a rough orientation, feed video prospecting hook rates commonly sit between 15 and 35 percent, with strong creative pushing higher. Treat that range as context, not as a target.
Where Hook Rate Fits in the Workflow
Creative teams get the most from it. In a testing programme where six video concepts launch at once, hook rate produces a usable read within a day, long before conversion data is stable. It answers the first question in the funnel, which is whether the ad is being noticed at all, and it does so without waiting for purchases to accumulate.
Media buyers use it to diagnose fatigue. A video that launched at a 28 percent hook rate and now runs at 17 percent against the same audience is being seen too often. Frequency has risen, novelty has worn off, and the ad is now scrolled past by people who once stopped. Hook rate decline typically precedes cost per acquisition decline by several days, which makes it an early warning rather than a post mortem.
Brands working with agencies and freelancers use it as a briefing tool. "Make the first three seconds stronger" is a vague instruction. "Our median hook rate is 21 percent and this concept is running at 12 percent, so the opening needs work while the rest of the edit stays" is a brief someone can act on.
The specific situations where hook rate becomes the deciding metric:
- High volume creative testing. When you are launching many variants, you need a fast signal to cut the bottom half before spend accumulates.
- Recutting existing assets. Testing three different openings on the same body of footage isolates the hook variable cleanly.
- UGC and influencer content. Creator videos vary wildly in opening quality, and hook rate is the fastest way to rank a batch of deliverables.
- Diagnosing a sudden performance drop. Splitting the drop into hook, hold, click, and convert stages localises the problem quickly.
Reading Hook Rate Correctly
The factors that determine whether the number is telling you something real:
- Placement consistency. Compare feed against feed. Blended hook rate across Stories, Reels, and feed reflects delivery mix as much as creative quality.
- Audience temperature. Warm audiences hook better because they recognise the brand. Mixing cold and warm makes the comparison meaningless.
- Sound on versus sound off. A video that depends on audio in the first three seconds will underperform in sound off environments regardless of quality.
- Aspect ratio and safe zones. A video cropped badly for vertical placement loses its hook because the key element sits outside the visible frame.
- Frequency at the time of measurement. A hook rate measured at frequency 1.2 and one measured at 4.5 are not comparable readings of the same creative.
- Downstream performance. Hook rate is not a business metric and correlates only loosely with revenue.
The last point sets the boundary on the metric's usefulness. There are cheap ways to buy attention that do not translate into customers. A shocking opening frame, an unrelated visual gag, or a fake interface element will all lift hook rate and produce traffic that has no interest in the product. The result is a strong hook, weak hold, poor click through, and worse conversion. Hook rate should always be read as the first stage in a sequence, and creative decisions should be made on the whole sequence rather than the opening number.
The sound off issue deserves attention because it is so often the actual explanation for a poor hook rate. A large share of feed video is watched without audio, particularly in the first seconds before someone decides to engage. A hook that relies on a spoken line will simply not register. Opening on movement, on text, on a visible product transformation, or on a recognisable problem state gives the ad a chance in both conditions.
Frequency is the other underrated variable. Because hook rate degrades predictably as the same person sees the same opening repeatedly, comparing a fresh creative against an established one without accounting for frequency will always flatter the new asset. When judging whether a new concept genuinely beats an incumbent, compare them at similar frequency levels or in a clean split test.
Summary
Hook rate divides three second video views by impressions and tells you what share of your audience stopped scrolling. Read alongside hold rate, it splits video performance into two separate diagnoses: whether the opening earns attention, and whether the rest of the ad justifies it. That split is what makes it actionable, because a low hook with a strong hold is a re edit rather than a rewrite.
Build your own baseline from your own creative history rather than importing a benchmark, hold placement and audience temperature constant when comparing, and account for frequency before declaring a winner. Then confirm any hook rate improvement downstream, because an opening that grabs the wrong people costs you money at exactly the same rate as one that grabs nobody.
FAQ
What is a good hook rate?
It depends on placement, audience, and format, so the useful benchmark is your own median across recent creative. As orientation, feed video prospecting commonly lands between 15 and 35 percent, but a 20 percent hook rate can be strong in one category and weak in another.
Should I use impressions or reach in the denominator?
Impressions gives an exposure level view, reach gives a person level view. Either works as long as you are consistent, since the two produce different numbers and mixing them across reports makes comparisons invalid.
What is the difference between hook rate and hold rate?
Hook rate measures how many people stopped in the first three seconds, calculated against impressions. Hold rate measures how many of those people watched to the end, calculated against three second views. Hook is about attention, hold is about retention.
Can hook rate be misleading?
Yes. Attention grabbing openings that are unrelated to the product raise hook rate while attracting people who will not buy. Always confirm improvements downstream in hold rate, click through rate, and cost per order before scaling based on hook alone.
How do I improve a low hook rate?
Put the most visually arresting moment in the first frame, assume sound is off, show the product or the problem immediately rather than building up to it, and check that the key visual sits inside the safe zone for the placement. Testing three different openings on the same footage isolates the variable cleanly.
Decisions start with trust
14-days for free