Turn Reporting Chaos Into an Executive Summary Leadership Actually Reads

Marketing reporting to leadership usually fails in one of two directions. Either it is a forty slide deck of channel breakdowns that nobody reads past slide three, or it is three numbers with no explanation, which generates more questions than it answers. Both failures come from the same cause: the report is built from the data that exists rather than from the decisions leadership actually needs to make. An executive summary works when it answers a fixed set of questions in a fixed order, explains variance rather than merely reporting it, and pushes everything else into an appendix that exists for the people who ask follow up questions.
What you will learn
Marketing reporting to leadership usually fails in one of two directions. Either it is a forty slide deck of channel breakdowns that nobody reads past slide three, or it is three numbers with no explanation, which generates more questions than it answers. Both failures come from the same cause: the report is built from the data that exists rather than from the decisions leadership actually needs to make. An executive summary works when it answers a fixed set of questions in a fixed order, explains variance rather than merely reporting it, and pushes everything else into an appendix that exists for the people who ask follow up questions.
The Five Questions Leadership Is Actually Asking
Strip away the format and every leadership team wants the same five things from marketing reporting.
Did we grow, and how much did it cost? Revenue and marketing spend, against plan and against the same period last year.
Are we acquiring customers efficiently? New customer count and customer acquisition cost, with the trend.
Is the growth sustainable? The ratio of new to returning revenue, and whether acquisition is keeping pace with the base.
What changed, and why? The single largest variance against expectation, with a causal explanation rather than a description.
What are we doing about it? Decisions taken and decisions needed.
Everything else in a marketing report is supporting evidence for one of these five. Structuring the summary around them, in this order, means the reader gets what they came for in the first ninety seconds.
The One Page Structure
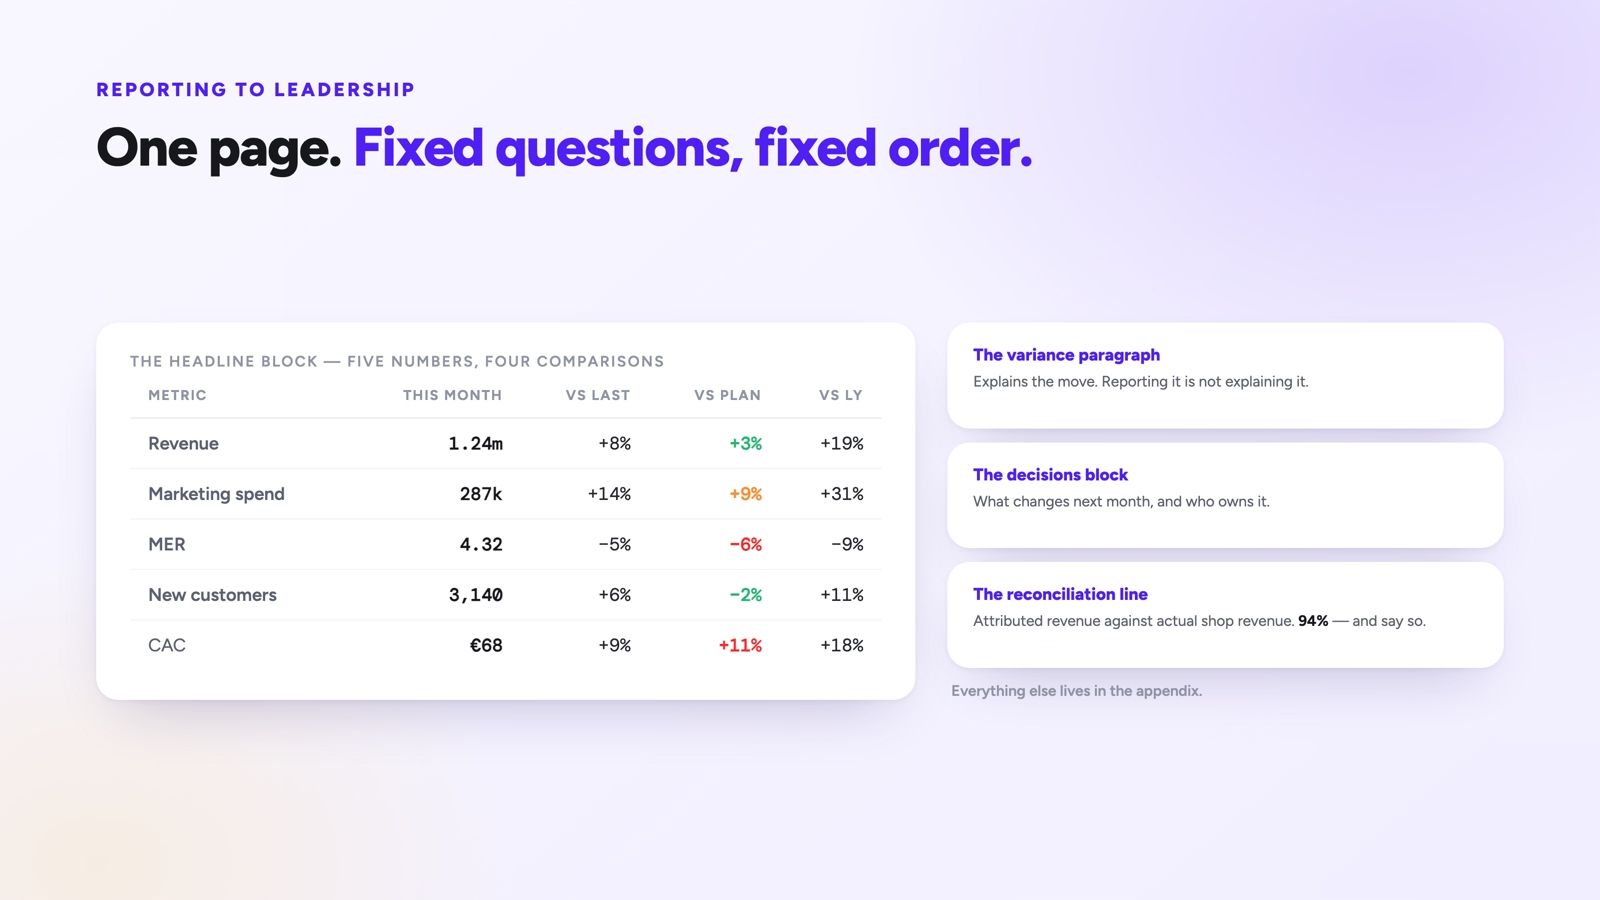
Headline block
Five numbers, each with the comparison that gives it meaning.
| Metric | This month | vs last month | vs plan | vs last year |
|---|---|---|---|---|
| Revenue | 1.24m | +8% | +3% | +19% |
| Marketing spend | 287k | +14% | +9% | +31% |
| MER | 4.32 | -5% | -6% | -9% |
| New customers | 3,140 | +6% | -2% | +11% |
| CAC | 68 euros | +9% | +11% | +18% |
This table does most of the work. It shows growth, cost, efficiency, and acquisition in one view, with enough comparison points that the reader can see whether a number is good without being told.
Marketing efficiency ratio belongs here rather than ROAS because it needs no attribution methodology to interpret and cannot be contested on measurement grounds. Total revenue divided by total marketing spend is a fact about the business.
The variance paragraph
One paragraph, not a list, explaining the most significant deviation. This is the part of the report that requires actual thinking and is the part most often replaced by a chart.
A description says efficiency declined 5 percent. An explanation says efficiency declined 5 percent because CPMs rose 18 percent across paid social during the seasonal peak while conversion rate held steady, meaning the decline reflects auction conditions rather than campaign performance, and comparable brands are experiencing the same pressure.
The difference is that the second version tells the reader whether to be concerned and what, if anything, to do. Distinguishing between external market conditions, deliberate strategic choices, and genuine execution problems is the single most valuable thing a marketing report can do, because leadership cannot make that distinction from the numbers alone.
The decisions block
Two short lists. Decisions made this period, with expected impact and timing. Decisions needed from leadership, with the options and a recommendation.
The second list is what makes the report a working document rather than a status update. A report that never asks for anything trains its audience to skim it.
Everything else goes in the appendix
Channel breakdowns, campaign performance, creative results, cohort curves, market splits. All of it useful, none of it belonging in the summary. The appendix exists so that when someone asks why paid social spend rose, the answer is available without rebuilding it.
Handling the Attribution Question
At some point leadership will ask why the channel numbers do not sum to total revenue, or why the marketing report disagrees with what the agency presented. Getting ahead of this is worth a permanent footnote.
State once, in the same words every month, which numbers come from where. Platform reported figures overlap and sum to more than actual revenue. Independently attributed figures assign each order once and reconcile to the shop system. Both appear in the appendix and they will not match.
The reconciliation line is what settles it: attributed revenue across all channels against actual shop revenue, shown as a percentage. If the attribution accounts for 94 percent of actual sales, say so, and the remaining 6 percent is honest unobserved journey rather than a discrepancy to explain away.
Doing this consistently converts a recurring argument into a footnote. Doing it inconsistently, or switching between platform and attributed numbers depending on which looks better, guarantees the argument recurs every month.
What Makes the Report Credible
The criteria that determine whether leadership trusts marketing reporting:
- Definitions never change silently. If CAC starts including agency fees, say so on the report where it changes.
- Bad news arrives first, from you. A miss explained in the summary is a managed situation. A miss discovered in the appendix is a credibility problem.
- The same metrics appear every month. Rotating metrics to show whichever looks best is transparent and destroys trust quickly.
- Estimates are labelled as estimates. Modelled contribution, incrementality assumptions, and lifetime value projections should be marked.
- Comparisons include year over year. Month over month alone cannot separate seasonality from performance.
- Length is capped. One page of summary. If it grows, something belongs in the appendix.
The point about consistency of metrics is the one most often violated under pressure. When a month goes badly there is real temptation to lead with the metric that held up. Leadership notices, usually not immediately, and the cost is that every future report is read with suspicion. A fixed metric set that occasionally shows bad numbers is worth more than a flexible one that always shows good ones.
The point about labelling estimates matters for a different reason. Marketing reporting necessarily contains modelled and assumed figures: modelled conversions, incrementality adjustments, projected lifetime value. Presenting these with the same visual weight as observed revenue invites them to be treated as equally certain, and the first time one turns out to be materially wrong, the observed numbers lose credibility alongside it. Marking them protects the rest of the report.
Adapting to the Audience
The structure holds across audiences, the emphasis shifts.
For a founder or CEO, weight new customer acquisition and MER, since those speak to growth capacity and cash. For a CFO, weight CAC payback period and contribution margin, since those speak to working capital. For a board, weight year over year trend and the ratio of new to returning revenue, since those speak to business quality rather than monthly execution.
In each case the one page structure is identical. Only the variance paragraph changes emphasis, because the question "should I be concerned" means something different to each of them.
Summary
An executive summary works when it answers five fixed questions in a fixed order: did we grow, what did it cost, is it sustainable, what changed and why, and what are we doing about it. A headline table with four comparison columns handles the first three. A single variance paragraph that distinguishes market conditions from strategic choices from execution problems handles the fourth. A decisions block, including decisions needed from leadership, handles the fifth.
Everything else belongs in an appendix. Keep the metric set fixed even when a particular month would look better with a different one, label modelled figures as modelled, include the reconciliation between attributed and actual revenue as a standing footnote, and lead with bad news rather than burying it. The report's value is not that it contains the data. It is that a reader who spends ninety seconds on it knows what happened, why, and what happens next.
FAQ
How long should a monthly marketing report be?
One page of summary, plus an appendix of any length. The summary is what gets read, the appendix is what gets consulted when someone asks a follow up. Mixing them means neither works.
Should I show ROAS or MER to leadership?
MER, because it requires no attribution methodology and therefore cannot be contested on measurement grounds. Channel level ROAS belongs in the appendix where the people who need it can find it.
How do I explain that channel numbers do not add up to total revenue?
With a standing footnote stating that platform reported figures overlap because each network claims orders it touched, while independently attributed figures assign each order once and reconcile to the shop system. Include the reconciliation percentage every month so it becomes routine rather than a recurring debate.
What do I do when the month was bad?
Lead with it in the variance paragraph, explain whether the cause was market conditions, a deliberate choice, or an execution problem, and state what changes as a result. A miss you explain is a managed situation. A miss leadership finds in the appendix is a credibility problem that outlasts the bad month.
How much detail on individual campaigns belongs in the summary?
None. Campaign level performance is appendix material. If a single campaign is significant enough to belong in a summary read by leadership, it belongs there as an explanation for a business level variance, not as a campaign report.
Decisions start with trust
14-days for free