LTV to CAC Ratio: How to Calculate It and What a Healthy Number Really Looks Like

The LTV to CAC ratio is the single number investors ask for first and the single number most ecommerce teams calculate inconsistently. Both halves are estimates, both are sensitive to the assumptions behind them, and a ratio built on revenue based lifetime value can look twice as healthy as the same business measured on contribution profit. This article covers how to calculate LTV to CAC properly, what the numbers mean once you have them, and why the widely repeated 3:1 benchmark comes from subscription software rather than from any business that ships physical products.
What you will learn
The LTV to CAC ratio is the single number investors ask for first and the single number most ecommerce teams calculate inconsistently. Both halves are estimates, both are sensitive to the assumptions behind them, and a ratio built on revenue based lifetime value can look twice as healthy as the same business measured on contribution profit. This article covers how to calculate LTV to CAC properly, what the numbers mean once you have them, and why the widely repeated 3:1 benchmark comes from subscription software rather than from any business that ships physical products.
Building Both Halves of the Ratio
The ratio itself is trivial.
LTV to CAC = customer lifetime value / customer acquisition cost
Everything difficult sits inside the two inputs.
Customer Acquisition Cost
CAC divides acquisition spend by the number of new customers acquired in the same period. The word "new" is doing the work. If you divide by total orders, you have calculated cost per order, which will be considerably lower and will make the ratio look far better than it is.
CAC = acquisition marketing spend / new customers acquired
The honest version excludes spend aimed at existing customers, since retention email and loyalty campaigns produce orders but not new customers. Whether you include agency fees, creative production, and salaries is a judgement call. Include them for company level planning, exclude them for channel comparison, and label which version you are showing.
Customer Lifetime Value
Lifetime value has at least three common definitions, and they produce very different numbers.
Revenue LTV multiplies average order value by purchase frequency by expected lifespan. It is the largest number and the least useful, because it ignores the cost of the goods you shipped.
Gross margin LTV applies gross margin to that revenue.
Contribution margin LTV subtracts everything variable: cost of goods, payment fees, shipping, packaging, returns, and any per order fulfilment cost. This is the version that belongs in the ratio, because it represents money the business actually keeps.
LTV = average order value x gross orders per customer x contribution margin %
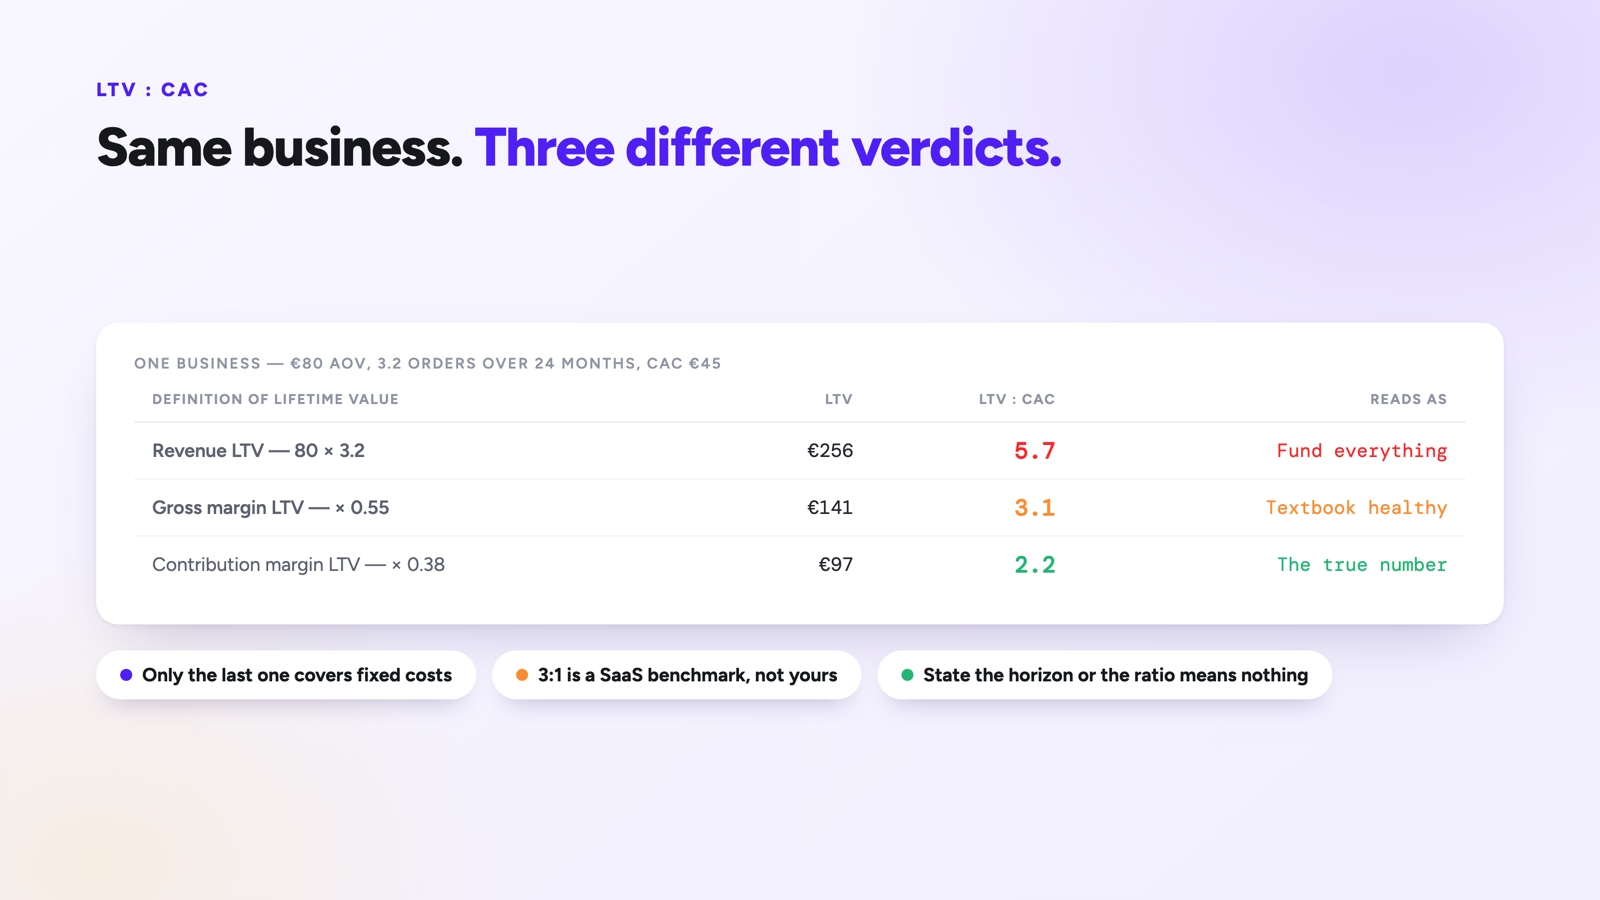
A worked example makes the spread obvious. Take an average order value of 80 euros, an average of 3.2 orders per customer over 24 months, and a contribution margin of 38 percent after cost of goods, shipping, payment fees, and returns.
| Definition | Calculation | LTV |
|---|---|---|
| Revenue LTV | 80 x 3.2 | 256 euros |
| Gross margin LTV (55%) | 80 x 3.2 x 0.55 | 141 euros |
| Contribution margin LTV (38%) | 80 x 3.2 x 0.38 | 97 euros |
Against a CAC of 45 euros, the same business reports a ratio of 5.7, 3.1, or 2.2 depending purely on which definition someone picked. Only the last one reflects money available to cover fixed costs and profit.
Bounding the Time Horizon
Lifetime value has no natural end point, which invites optimism. A brand three years old cannot honestly claim a five year lifetime value. The workable approach is to fix a horizon that matches your planning cycle, usually 12 or 24 months, and calculate the ratio inside it. A 24 month LTV to CAC of 2.5 is a defensible statement. An unbounded LTV to CAC of 6.0 usually means someone extrapolated a cohort curve past the data.
Who Uses the Ratio and When
The LTV to CAC ratio is a funding and strategy metric, not an operating metric. Nobody adjusts a bid because the ratio moved. It shows up in four places.
Founders and finance teams use it to answer whether growth is worth funding. A ratio comfortably above the cost of capital says that spending more on acquisition creates value, assuming the ratio holds as you scale. A ratio near 1.0 says the business is buying customers at roughly what they are worth, which is a treadmill.
Investors use it as a proxy for business quality, which is why the number gets inflated. Anyone presenting a ratio in a fundraise should expect the definitions to be interrogated, and should present the contribution margin version rather than the revenue version, since the revenue version signals either naivety or spin.
Heads of growth use it to compare cohorts and channels. This is where it becomes genuinely operational. Customers acquired through branded search often show a high ratio because CAC is low, while customers from a broad prospecting campaign may show lower CAC efficiency but a longer repeat curve. Calculating the ratio per acquisition channel, rather than blended, is what turns it into an allocation tool.
Retention and CRM teams use it in reverse. If CAC is fixed by market conditions, the only lever left is the numerator, which means repeat rate, average order value, and margin. A ratio that improves because retention improved is worth more than one that improves because a temporary CPM dip lowered CAC.
Reading the Number Correctly
A short list of the factors that decide whether your ratio means anything:
- Which LTV definition. Contribution margin LTV or the number is decorative.
- Which time horizon. State it explicitly. "3.2 over 24 months" is information. "3.2" alone is not.
- Cohort versus blended. Blended LTV mixes a five year old cohort with last month's, which flatters the average during a growth slowdown.
- CAC denominator. New customers, not orders.
- Channel level view. A blended 3.0 can hide one channel at 6.0 and another at 0.9.
- Payback period. A ratio of 4.0 that takes 20 months to realise can bankrupt a business that a ratio of 2.5 with a 3 month payback would not.
That final point is the most important and the most frequently ignored. The LTV to CAC ratio says nothing about time. Two businesses with an identical ratio of 3.0 have completely different cash requirements if one recovers its acquisition cost on the first order and the other recovers it over two years. Ratio tells you whether growth is profitable. Payback period tells you whether you can survive long enough to see it. Both belong in the same view.
The famous 3:1 benchmark deserves scepticism as well. It originates in venture backed SaaS, where gross margins run above 80 percent, revenue is contractual and recurring, and churn is measurable monthly. Physical product businesses operate at 30 to 60 percent contribution margin with voluntary, irregular repurchase. Applying a SaaS benchmark to that structure is comparing two different economies. A well run ecommerce brand at 2.5 on contribution margin LTV with a four month payback is in a stronger position than a brand claiming 4.0 on revenue LTV.
The last practical risk is that both inputs depend on attribution. If your measurement over credits branded search and retargeting, the CAC on those channels looks artificially low and their LTV to CAC ratio looks artificially high, which pushes budget toward channels that were harvesting demand rather than creating it. A ratio calculated per channel is only as trustworthy as the attribution model underneath it.
What to Do With It
The LTV to CAC ratio compares what a customer is worth against what they cost to acquire, and it is only as honest as its two inputs. Use contribution margin lifetime value rather than revenue, divide by new customers rather than orders, bound the calculation to a stated time horizon, and calculate it per cohort and per acquisition channel rather than blended across the business.
Treat the ratio as one half of a pair. On its own it tells you whether acquisition creates value. Alongside CAC payback period it tells you whether you can afford the wait. And before trusting the channel level breakdown, confirm that the attribution assigning orders to channels applies the same rules everywhere, because a channel that looks like it has the best ratio in the business is often just the one your measurement is most generous toward.
FAQ
Should I use revenue or profit for lifetime value?
Contribution profit, after cost of goods, shipping, payment fees, and returns. Revenue LTV overstates the ratio by a factor of two or three in most ecommerce businesses and leads directly to overspending on acquisition.
Is 3:1 a good LTV to CAC ratio?
It is a SaaS benchmark applied far outside its origin. For a physical product business measured on contribution margin over a fixed 12 to 24 month horizon, anything above roughly 2.0 with a short payback period is workable, and the payback figure matters as much as the ratio.
How far into the future should lifetime value project?
Only as far as your data supports, capped at your planning horizon. Twelve months is conservative and defensible, twenty four months is common. Anything beyond three years is extrapolation dressed as measurement.
Why does my ratio look worse when I calculate it per channel?
Because blending hides variance. A blended ratio averages a cheap, high intent channel against expensive prospecting. The per channel view is the accurate one, and the weak channels it exposes are usually where the marginal budget has been going.
Can the ratio be too high?
Yes. A ratio above roughly 5.0 usually means you are underinvesting in acquisition and leaving growth on the table, or that your CAC is understated because measurement is crediting cheap harvesting channels for demand created elsewhere.
Decisions start with trust
14-days for free