CPM Explained: What Cost Per Mille Means, How It Is Calculated, and What Moves It

CPM is the closest thing digital advertising has to a market price. It reflects what every other advertiser is willing to pay to reach the same person at the same moment, which is why it rises every November whether or not you changed anything, and why a narrow audience can cost three times more per impression than a broad one. Cost per mille is not a performance metric in the usual sense. It measures the price of the raw input, and reading it correctly is what lets you distinguish a campaign problem from a market condition.
What you will learn
CPM is the closest thing digital advertising has to a market price. It reflects what every other advertiser is willing to pay to reach the same person at the same moment, which is why it rises every November whether or not you changed anything, and why a narrow audience can cost three times more per impression than a broad one. Cost per mille is not a performance metric in the usual sense. It measures the price of the raw input, and reading it correctly is what lets you distinguish a campaign problem from a market condition.
Definition and Calculation
CPM stands for cost per mille, from the Latin for thousand. It is the cost of one thousand ad impressions.
CPM = (total ad spend / total impressions) x 1000
Spend 4,500 euros to deliver 500,000 impressions and the CPM is 9 euros. The multiplication by a thousand is the only thing that distinguishes it from a simple cost per impression, and it exists because per impression costs would otherwise be quoted in fractions of a cent.
An impression means the ad was served and had an opportunity to be seen. Viewability standards differ by platform and format, and a served impression is not the same as an impression a human actually looked at. This matters when comparing CPMs across environments with different viewability standards, and it is one reason display CPMs look cheap next to social CPMs.
CPM Inside the Cost Chain
CPM is the first link in a chain that ends at cost per order.
CPC = CPM / (CTR x 1000)
CPA = CPC / conversion rate
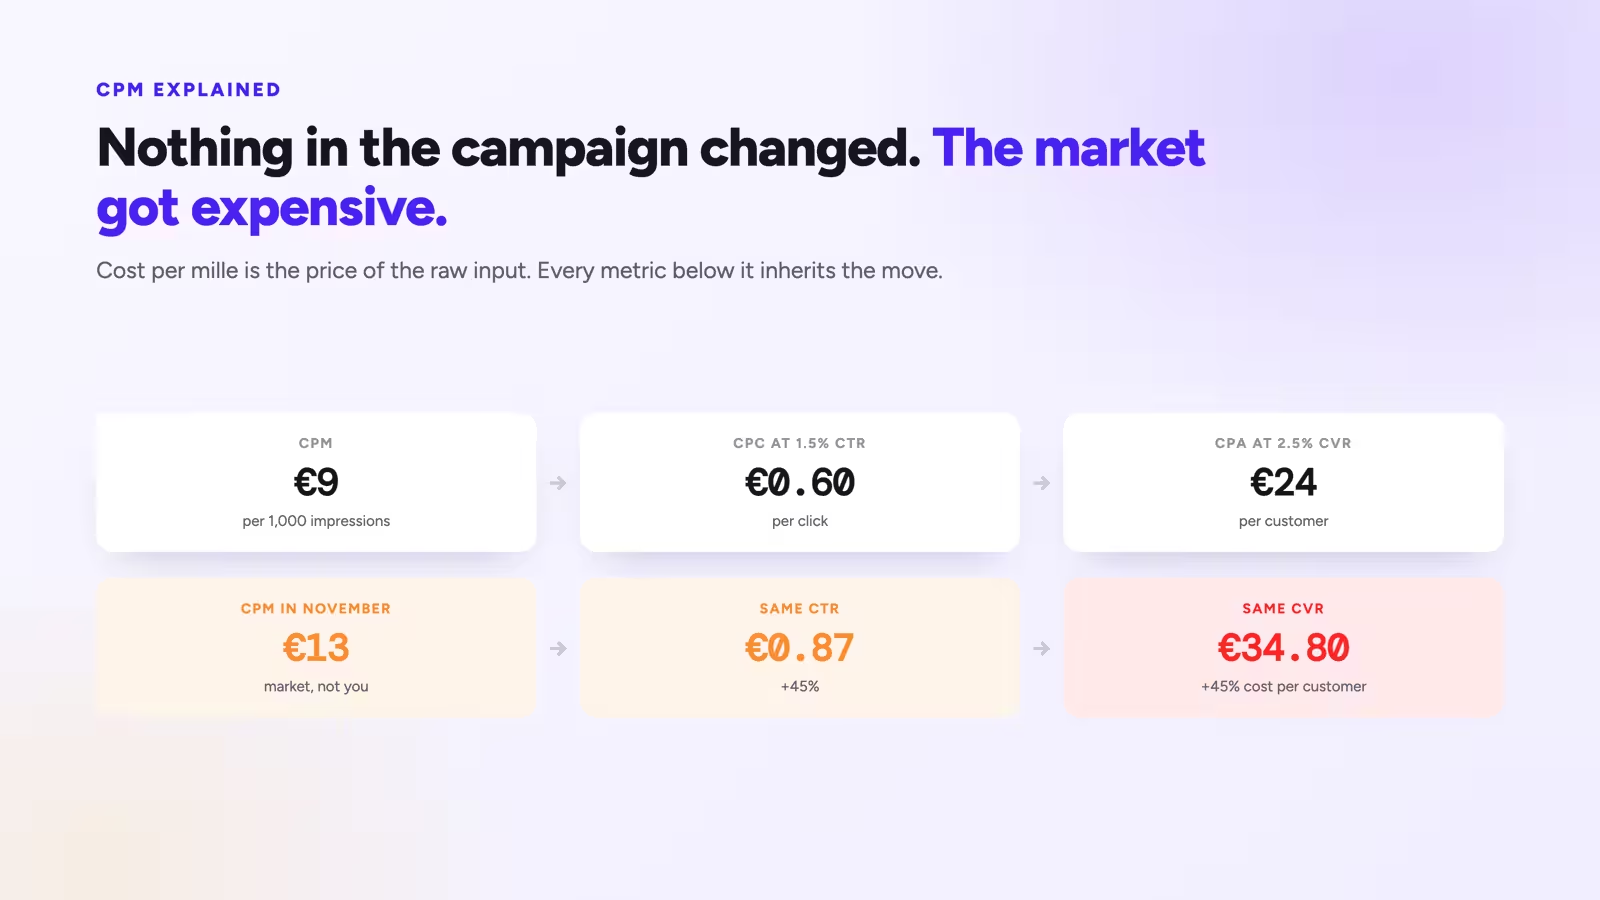
Work an example through. A CPM of 9 euros means a thousand impressions cost 9 euros. At a 1.5 percent CTR, those impressions produce 15 clicks, so CPC is 0.60 euros. At a 2.5 percent conversion rate, it takes 40 clicks to make a sale, so cost per acquisition is 24 euros.
Now raise CPM to 13 euros, which is a realistic seasonal move, and hold everything else constant. CPC becomes 0.87 euros and CPA becomes 34.80 euros. Nothing about the campaign changed. The market got more expensive and the cost per customer rose 45 percent.
This chain is the reason CPM is worth watching even though you cannot control it. It is the input that silently moves everything downstream.
What Actually Drives CPM
Cost per mille is set by an auction, so it reflects demand for a specific audience at a specific moment.
Audience value and competition. Advertisers bid more for audiences that convert well. Retargeting audiences, high income segments, and in market shoppers all carry higher CPMs because many advertisers want them simultaneously.
Audience size. Narrow targeting raises CPM because the platform has fewer opportunities to find a cheap impression. A tightly defined interest stack can double CPM against broad targeting with the same budget.
Seasonality. November and December CPMs commonly run 30 to 80 percent above the annual average in consumer categories, as retail budgets concentrate into a few weeks.
Placement and format. Feed placements cost more than audience network or right column. Video and Reels price differently from static images. A change in placement distribution changes blended CPM without any strategic change.
Ad quality and relevance. Platforms discount effective CPM for ads that generate engagement, because engaging ads keep users on the platform. A poorly performing creative pays a premium for the same inventory.
Optimisation goal. Optimising for purchases means the platform hunts for people likely to purchase, and those impressions cost more than impressions optimised for reach or traffic.
Geography. CPMs in Germany, Switzerland, and the Nordics run well above those in Southern and Eastern Europe, reflecting purchasing power and advertiser density.
Where CPM Gets Used
Media buyers use CPM as a market indicator. When cost per order rises, the first diagnostic question is whether CPM moved. If it did, the campaign is not broken, the auction changed, and the correct response is a budget or margin decision rather than a creative overhaul.
Brand and awareness campaigns use CPM as the primary efficiency metric, because reach is the objective. There is no conversion to optimise against, so the question becomes how cheaply the message reached the target audience at sufficient frequency.
Media planners use CPM to size budgets. Reaching 400,000 people three times means 1.2 million impressions, which at a 10 euro CPM requires 12,000 euros. That calculation is the basis of nearly every reach plan.
Finance and leadership rarely need CPM directly, but they need the explanation it provides. When acquisition costs rise across every channel simultaneously, CPM inflation is usually the reason, and being able to show it prevents a productive conversation about market conditions turning into an unproductive one about team performance.
The moments where CPM becomes the centre of attention:
- Q4 planning. Budget models built on annual average CPMs will underdeliver reach in the peak weeks.
- Audience strategy shifts. Moving from broad to narrow targeting trades CPM for precision, and the trade is not always worth it.
- New market entry. CPM levels in a new geography determine whether the planned budget can generate meaningful frequency at all.
- Sudden performance drops. Splitting cost per order into CPM, CTR, and conversion rate isolates the cause in minutes.
Reading CPM Without Misdiagnosing
The criteria that keep the metric honest:
- Compare like with like. Same placement mix, same geography, same optimisation goal, same audience type. Blended CPM across all of these is close to meaningless.
- Track it as a trend, not a level. The useful information is the change against your own baseline, not the absolute number against someone else's benchmark.
- Split by placement. A rising blended CPM often just means the platform shifted delivery toward more expensive placements.
- Read it with frequency. A rising CPM alongside rising frequency usually means your audience is too small for the budget.
- Never optimise for it directly. The cheapest impressions are cheap because nobody wants them.
That final point is the most common failure mode. It is easy to lower CPM: broaden targeting, add cheap placements, switch the optimisation goal away from purchases. Each of these buys more impressions per euro and fewer customers per euro. A team that treats CPM as a performance target will drive it down and watch conversion rate fall further, ending with a higher cost per order and a better looking cost per thousand.
The frequency relationship deserves more than a bullet. When budget grows faster than addressable audience, the platform has to show the same ads to the same people more often. Frequency rises, CTR falls, and CPM often rises too as the platform reaches deeper into the auction for the remaining impressions. The three moving together is the signature of audience saturation, and the fix is audience expansion or creative variety rather than bid adjustment.
Finally, remember that CPM is unaffected by tracking and consent. It is measured entirely inside the ad platform, so it stays reliable even when conversion tracking degrades. That makes it a stable reference point during periods when downstream measurement is uncertain, which is exactly when a clean diagnostic is most valuable.
Summary
CPM is total spend divided by impressions, multiplied by a thousand, and it represents the market price of reaching your audience. It is driven by competition for that audience, audience size, seasonality, placement mix, creative quality, optimisation goal, and geography, most of which sit outside your direct control.
Use it as a diagnostic and a planning input rather than a target. When acquisition costs move, decompose them into CPM, click through rate, and conversion rate to find out whether the market changed or the campaign did. Track CPM against your own baseline with placement and geography held constant, watch it alongside frequency to catch audience saturation early, and resist the temptation to optimise for cheaper impressions, since the cheapest attention is usually cheap for a reason.
FAQ
What is a good CPM?
There is no portable benchmark, because CPM depends on country, audience, placement, format, and season. A Meta prospecting CPM in Germany might sit between 6 and 15 euros, with narrow retargeting audiences considerably higher and Q4 well above the annual average. Compare against your own history rather than an external figure.
Why did my CPM rise without any campaign changes?
Most commonly seasonality or new competition in your auction. Audience saturation, a shift in placement delivery, and creative fatigue reducing your relevance score are the other usual causes. Check the trend by placement before assuming a market wide change.
Does a lower CPM mean better performance?
Not on its own. Cheaper impressions can be cheaper because fewer advertisers want that audience, which usually means it converts poorly. Judge on cost per order and contribution profit, and use CPM to explain why those numbers moved.
How does CPM relate to CPC?
CPC equals CPM divided by click through rate times a thousand. That means a rise in CPM raises cost per click proportionally unless creative performance improves at the same time to offset it.
Should CPM be used for performance campaigns?
As a diagnostic, yes. As an optimisation objective, no. Performance campaigns should optimise for conversions or conversion value, and CPM should be read afterwards to understand what the auction cost you.
Decisions start with trust
14-days for free