The Creative Engine: A Repeatable System for Finding Winning Ads

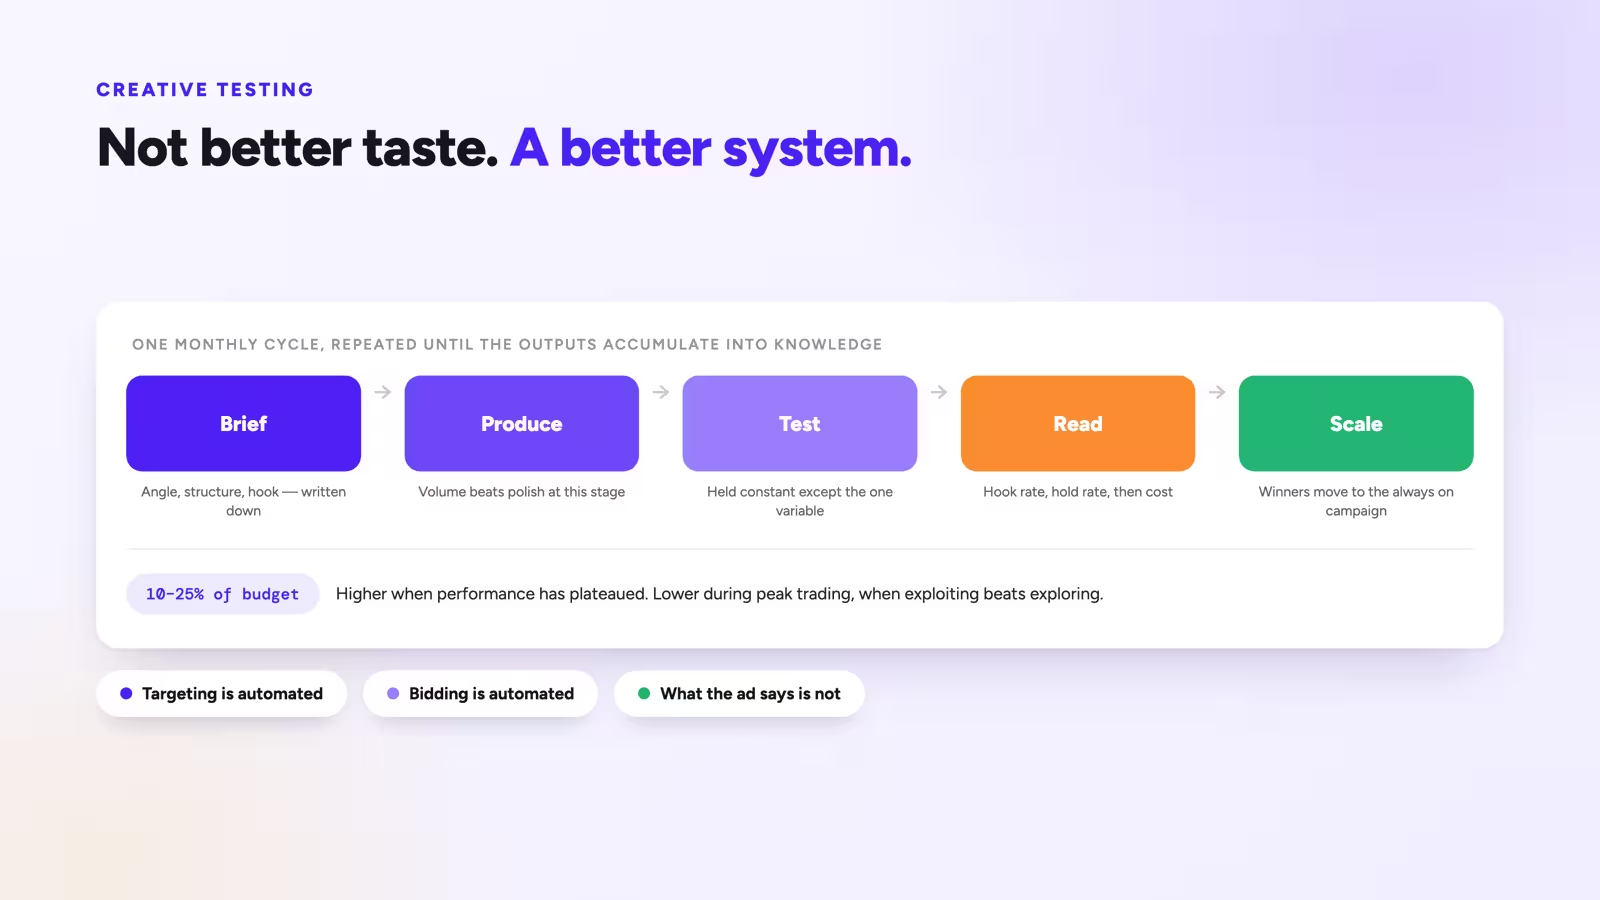
Creative is the largest remaining lever in paid media. Targeting has been automated, bidding has been automated, and placement selection has been handed to the platform. What is left is what the ad says and shows, and the brands that win are not the ones with better taste. They are the ones with a system that produces more tested variations per month and reads the results properly. A creative engine is that system: a repeatable monthly cycle of briefing, producing, testing, reading, and scaling, with enough structure that the outputs accumulate into knowledge rather than resetting every quarter.
What you will learn
Creative is the largest remaining lever in paid media. Targeting has been automated, bidding has been automated, and placement selection has been handed to the platform. What is left is what the ad says and shows, and the brands that win are not the ones with better taste. They are the ones with a system that produces more tested variations per month and reads the results properly. A creative engine is that system: a repeatable monthly cycle of briefing, producing, testing, reading, and scaling, with enough structure that the outputs accumulate into knowledge rather than resetting every quarter.
The Cycle
The engine runs on a monthly rhythm with four stages. Each stage has a defined output that feeds the next.
Week one, brief. Decide what to test based on last month's results and the gaps in your testing grid. The output is a production brief specifying angle, format, product, and offer for each asset.
Weeks one and two, produce. Create the assets. The output is a batch of ads named according to a structured convention so results are analysable later.
Weeks two and three, test. Launch into a testing structure with enough budget to reach significance. The output is performance data per asset.
Week four, read and scale. Analyse by dimension rather than by individual ad, move winners into scaling campaigns, and write the next brief. The output is a decision and a new brief, which restarts the cycle.
The monthly cadence matters. Faster than monthly and results do not have time to stabilise on most account sizes. Slower and the engine produces too few tested variations to find outliers.
The Testing Grid
The brief should not come from opinion about what might work. It should come from a grid of what has been tested and what has not.
Build a matrix with creative angle on one axis and format on the other. Fill in how many assets have been tested in each cell and how they performed. The empty and underpopulated cells are your brief.
| UGC video | Studio video | Static | Carousel | |
|---|---|---|---|---|
| Problem led | 6 tested, strong | 2 tested, weak | 4 tested, average | 0 tested |
| Social proof | 3 tested, average | 1 tested, average | 8 tested, strong | 2 tested, weak |
| Comparison | 0 tested | 0 tested | 1 tested, weak | 0 tested |
| Founder story | 2 tested, strong | 1 tested, average | 0 tested | 0 tested |
This grid immediately produces a brief. Comparison angles are almost entirely untested, founder story works in UGC and has never been tried in static, and problem led UGC is your strongest known combination and deserves more volume rather than less.
The grid only exists if ad names carry structured metadata. This is the practical reason naming conventions matter: without angle and format as named dimensions, building this table requires someone to manually categorise every ad in the account, which means it gets built once and never updated.
What to Vary and What to Hold
The most common testing failure is varying everything at once. Six new ads that differ in angle, format, product, hook, and offer produce a winner nobody can learn from, because there is no way to know which difference mattered.
Structure tests so that one dimension varies at a time within a batch:
- Angle tests. Same product, same format, same offer, four different persuasive approaches.
- Hook tests. Same body content, four different openings. This is the highest leverage single variable in video, since hook rate determines how many people see anything at all.
- Format tests. Same angle and message, produced as UGC video, studio video, and static.
- Offer tests. Same creative, different offer framing. These belong in a separate cycle because offer changes affect margin, not just performance.
Hook testing deserves particular emphasis because it is cheap. Recutting the first three seconds of an existing video costs a fraction of a new production and frequently produces a larger performance change than a new concept. A video with a weak hook rate and a strong hold rate is a good ad with a bad opening, and that is an editing job.
Reading Results Properly
The reading stage is where most engines fail, because the instinct is to sort by cost per acquisition and scale the top ad. Three things make the reading better.
Read by dimension, not by asset. Individual ad performance is noisy. The useful question is whether problem led angles beat social proof angles across all the assets in each group, which aggregates enough volume to mean something.
Use the metric that matches the stage. Hook rate and hold rate diagnose the creative itself. Click through rate diagnoses whether the message drives action. Cost per acquisition and contribution margin diagnose the business outcome. An ad can win on one and lose on another, and knowing which tells you what to fix.
| Stage | Metric | What a failure here means |
|---|---|---|
| Attention | Hook rate | Opening does not stop the scroll |
| Retention | Hold rate | Ad does not sustain interest |
| Action | Click through rate | Message does not create desire to act |
| Conversion | Post click conversion rate | Ad promised something the page does not deliver |
| Value | Contribution margin per order | Ad attracts discount seekers or low margin baskets |
Check profit, not only revenue. An ad leaning on a discount code will win on cost per acquisition and lose on contribution margin. If your creative reporting shows only revenue based metrics, the engine will systematically select for discounting.
The final row of that table is the one most creative reviews omit entirely, and it is where an engine either builds the business or slowly erodes it.
Structuring the Account for Testing
The engine needs somewhere to run that does not disturb the campaigns carrying your volume.
A common structure separates testing from scaling. A testing campaign runs new assets against a broad audience with enough budget per asset to accumulate meaningful data, typically at least the platform's optimisation event threshold within the test window. A scaling campaign holds proven winners at higher budget.
Winners graduate from testing to scaling. Losers are cut. Assets that are ambiguous get one recut, usually of the hook, and one more test.
The budget split is a judgement call, but reserving somewhere between 10 and 25 percent of paid budget for testing is common. Below 10 percent the engine produces too few tested assets to find outliers. Above 25 percent you are spending too much on exploration relative to exploitation, unless performance has stalled and finding new winners is the priority.
The Factors That Determine Whether It Works
- Volume of tested assets. Winners are outliers, and finding outliers requires attempts. Ten tested assets a month finds more than three.
- Structured naming. Without it, results cannot be aggregated by dimension and the grid cannot be built.
- A real testing budget. Assets that never reach statistical meaningfulness produce noise dressed as findings.
- Profit in the reporting. Otherwise the engine optimises toward discounting.
- Discipline about one variable at a time. Otherwise winners teach you nothing.
- A written brief each cycle. Otherwise production drifts toward what is easiest to make.
The volume point is the one that separates brands who feel creative is working from brands who feel stuck. Creative performance is a heavy tailed distribution: most assets are mediocre, a few are good, and occasionally one is transformative. You cannot reason your way to the transformative one. You find it by making enough attempts that the tail becomes reachable, and by having a structure that recognises it when it appears rather than losing it in an unstructured account.
The written brief matters for a less obvious reason. Without one, production defaults to whatever the team can make quickly, which over time means more of the same format and angle. The brief is what forces the engine into untested cells of the grid, which is where the next transformative asset is more likely to be found than in the cell you have already tested twelve times.
Summary
A creative engine is a monthly cycle: brief from the gaps in your testing grid, produce a batch of structurally named assets, test with one variable varying at a time and enough budget to matter, then read results by dimension rather than by individual ad and graduate winners into scaling campaigns.
The prerequisites are structured ad naming so results can be aggregated, a dedicated testing budget of roughly 10 to 25 percent, and profit metrics in the creative report so the engine does not select for discounting. The output is not just better ads this month. It is an accumulating map of which angles and formats work for your products, which makes each subsequent cycle better targeted than the last.
FAQ
How many creative assets should I test per month?
As many as your budget supports reaching meaningful data on, which for most brands means somewhere between six and fifteen. Testing thirty assets on a budget that gives each one twenty impressions produces noise, not findings.
How much budget should go to testing?
Commonly 10 to 25 percent of paid media budget. Lean toward the higher end when performance has plateaued and finding new winners matters more than squeezing existing ones, and toward the lower end during peak trading when exploitation matters more.
What is the single highest leverage thing to test?
The hook, meaning the first three seconds of video. It is cheap to vary because it reuses existing footage, and it determines how many people see the rest of the ad at all. A weak hook with a strong hold rate is the clearest signal that a recut will pay.
How do I know when a test has run long enough?
When each variant has accumulated enough conversion events to distinguish it from the others, which usually means at least the platform's optimisation threshold. Judging on click metrics can happen within a day or two, judging on cost per acquisition typically needs one to two weeks.
Should I test offers alongside creative?
Keep them in separate cycles. Offer changes affect contribution margin directly, so a discount ad will win on cost per acquisition while losing money. Test creative with offer held constant, then test offers as a distinct exercise with margin as the success metric.
Decisions start with trust
14-days for free