Revenue Attribution: Why Weighting by Revenue Beats Counting Conversions

.webp)
Most attribution debates are about which touchpoint deserves credit. This one is about what the credit is made of. Revenue attribution assigns euros to touchpoints; conversion-counted attribution assigns tallies, treating a €40 single-item order and a €400 bundle as the same unit of success. For any store with variable order values, that equal treatment quietly distorts every channel comparison you make. This article defines revenue attribution, shows the same dataset under conversion-counted and revenue-weighted views, and demonstrates with concrete math how counting conversions hides your premium-AOV channels and over-feeds your volume channels.
What you will learn
Most attribution debates are about which touchpoint deserves credit. This one is about what the credit is made of. Revenue attribution assigns euros to touchpoints; conversion-counted attribution assigns tallies, treating a €40 single-item order and a €400 bundle as the same unit of success. For any store with variable order values, that equal treatment quietly distorts every channel comparison you make. This article defines revenue attribution, shows the same dataset under conversion-counted and revenue-weighted views, and demonstrates with concrete math how counting conversions hides your premium-AOV channels and over-feeds your volume channels.
What Is Revenue Attribution?
Revenue attribution is the practice of distributing the monetary value of each order, not just the fact of its existence, across the marketing touchpoints that contributed to it. If a €200 order followed a journey of Meta ad, email, and branded search, a revenue attribution model splits the €200 between those touchpoints according to whatever crediting logic you use. The output is euros per channel, directly comparable against euros spent.
A note on the term, because it is used in two different worlds. In B2B and CRM contexts, "revenue attribution" often means connecting closed-won deal revenue back to campaigns in Salesforce or HubSpot. This article anchors the term in its marketing attribution sense for eCommerce: weighting attribution credit by order value. The mechanics of how credit gets split across touchpoints are covered in our marketing attribution guide; this piece is about what gets split.
That distinction matters because the two halves of attribution are independent. One axis is the crediting model (last-click, linear, data-driven). The other axis is the unit of credit: conversions or revenue. You can run a sophisticated multi-touch model and still count conversions, and many tools do exactly that, which is the problem this article is about.
The Hidden Assumption in Most Attribution Tools
Every conversion-counted report carries an assumption nobody agreed to: all orders are worth the same. The moment your store sells anything at more than one price point, that assumption is false, and the error scales with your average order value (AOV) variance.
Think about what a DTC brand actually sells: a €35 single item, a €90 two-pack, a €180 bundle, maybe a €400 device or gift set. A conversion-counted view scores the channel that drove the €35 order and the channel that drove the €400 order identically: one conversion each. The €400 order is worth more than eleven of the €35 orders in revenue terms, and the report renders that difference invisible.
This assumption hides in plain sight because the most-watched metrics inherit it. CPA (cost per acquisition) is spend divided by a count. Conversion rate is a count divided by a count. Channel reports ranked by "conversions" are sorted tallies. A team can be diligently data-driven on these metrics and still be systematically wrong about channel value, because the metrics weigh a €40 customer and a €400 customer equally.
Conversion-Counted vs Revenue-Weighted: Side-by-Side
Here is one month for a fictional DTC brand, with credit already assigned by the same multi-touch model in both views. The only thing that changes between the two tables is the unit: counts versus euros. This is revenue vs conversion attribution isolated from every other variable.
The raw data:
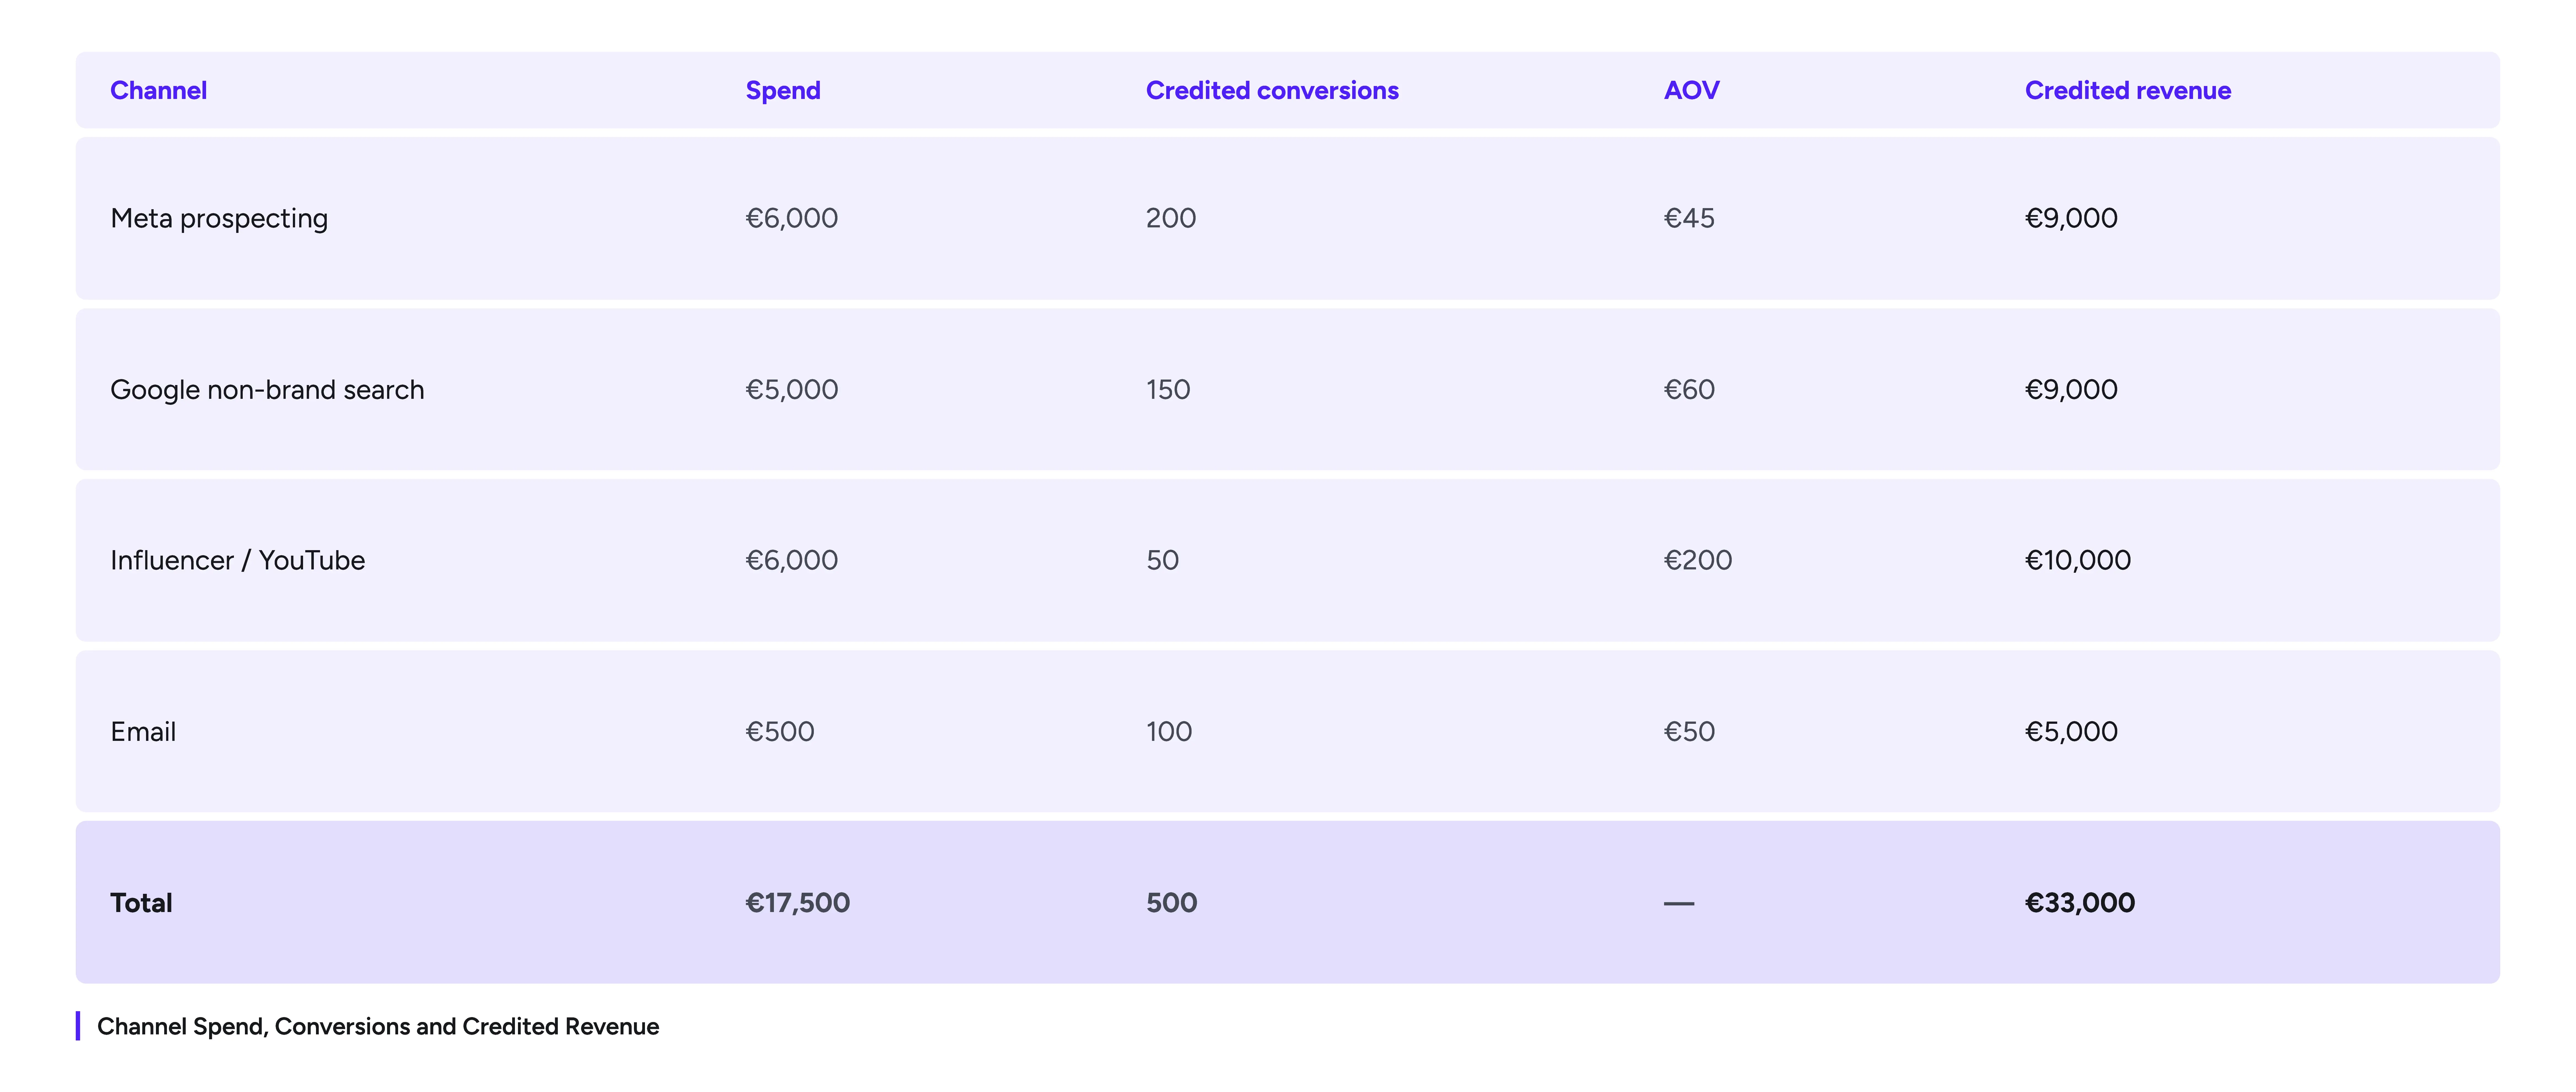
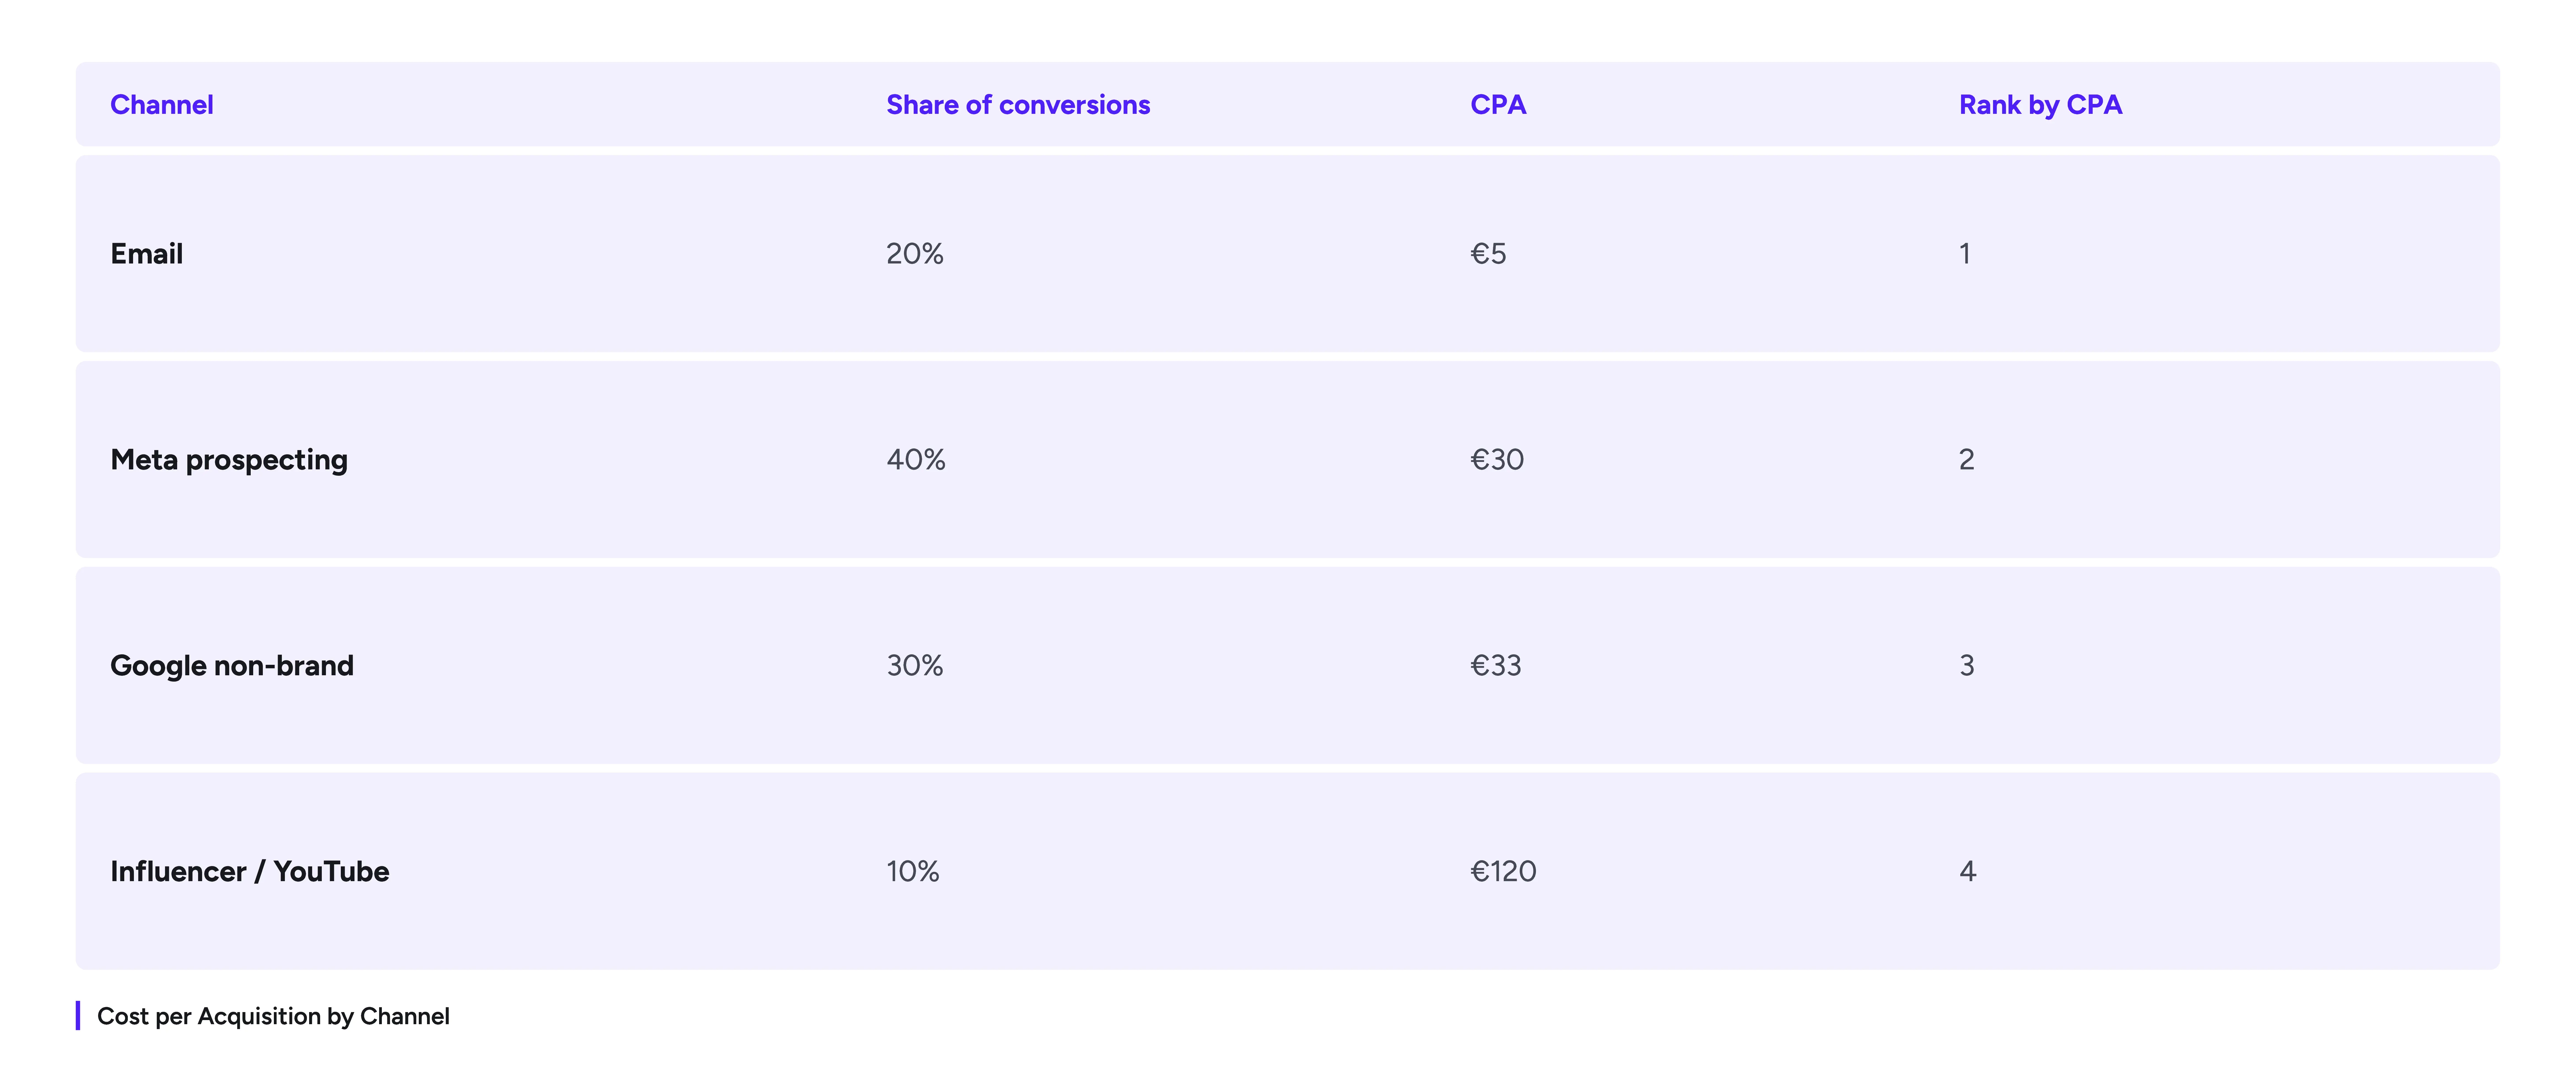
The conversion-counted view, which is what most dashboards show:
The revenue-weighted view, same month, same orders:
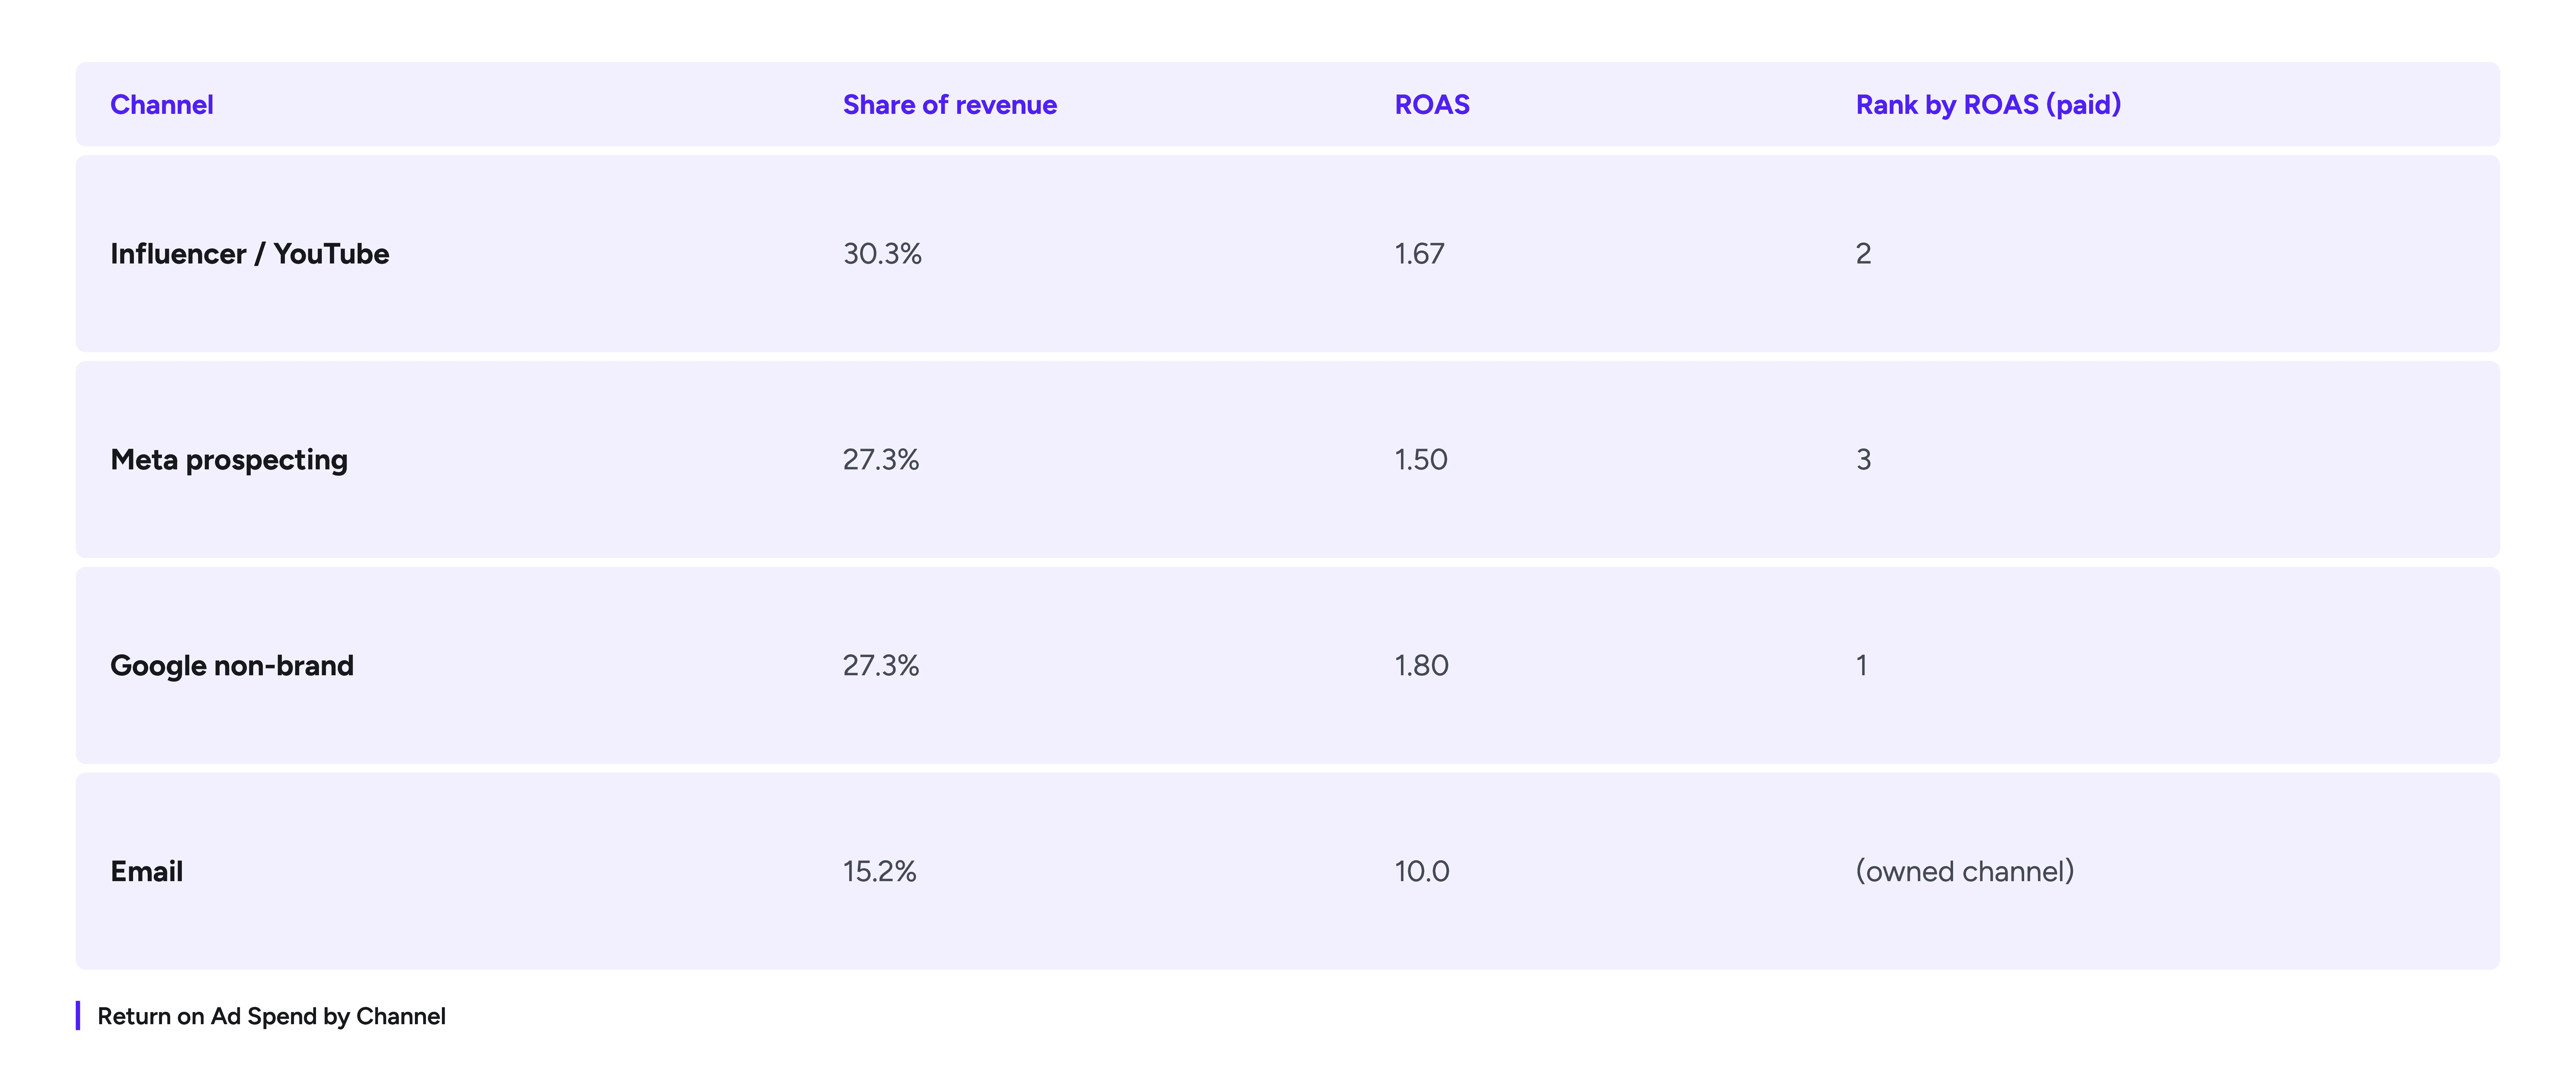
Read the influencer row across both tables. By conversion count it is the worst channel in the account: 10% of conversions at a €120 CPA, four times Meta's. By revenue it is the single largest contributor, 30% of all credited revenue, with a better ROAS than Meta. Nothing about performance changed between the tables. Only the unit of measurement did.
The AOV Problem: When €40 and €400 Orders Look Identical
The mechanism behind that reversal is AOV variance. Influencer traffic in this example buys €200 bundles; Meta prospecting drives €45 single-item first orders. A conversion-counted view compresses that 4.4x difference in order value to zero, because its unit of account cannot express it.
This is Kickbite's core position on the topic, and it is worth stating plainly: a €40 order and a €400 order should not carry equal weight when allocating credit, for the same reason your finance team does not report "number of invoices" as revenue. Weight per order should equal the value of the order. Anything else builds a systematic bias into your reporting, and the direction of the bias is predictable: channels that drive many small orders get inflated, channels that drive fewer large orders get buried.
The bias is worst exactly where modern DTC catalogs create it. Single item versus bundle. Trial size versus full routine. Core product versus device or gift set. Subscription first order versus one-off. If your AOV histogram has more than one peak, conversion counting is not a simplification of your business; it is a misrepresentation of it, and the budget decisions built on it inherit the error.
Which attribution model fits your business? Take the Attribution Model Matcher A short interactive quiz that matches your volume, channel mix, and AOV profile to the right attribution setup, with the reasoning shown. Take the quiz →
What Revenue Weighting Reveals About Your Channel Mix
Switching the unit from counts to euros does not just rerank a table; it changes which strategic facts about your mix are visible at all.
Premium-AOV Channels Hidden by Last-Click
Channels that attract considered, high-value purchases tend to get hit twice. First by conversion counting, as shown above. Then by last-click crediting, because high-AOV purchases have longer, multi-touch journeys, so the channel that started them rarely also ends them; that compounding is exactly the dynamic our multi-touch attribution guide unpacks. Influencer content, YouTube reviews, and podcast sponsorships are the classic victims: low conversion counts, long journeys, large baskets. Revenue-weighted multi-touch attribution is the configuration in which these channels become visible; in any other configuration they look like expensive hobbies.
Volume Channels Over-Credited by Conversion Count
The mirror image: channels optimized to harvest cheap conversions look better the cruder your measurement is. Discount-code retargeting, low-funnel promo emails, and broad prospecting tuned to a cheap-CPA goal all produce impressive tallies of small orders. They are not worthless, but a conversion-counted view cannot tell you whether they are profitable, because a €5 CPA on €30 orders with a 40% discount attached can easily be value-destroying while topping the CPA leaderboard. Revenue weighting is the first step in catching this; margin weighting, where you attribute contribution profit instead of revenue, is the rigorous endgame.
The DTC "Hero SKU" Distortion
Most DTC brands have a hero SKU: one bestseller at an accessible price point that dominates order counts. Conversion-counted attribution makes every channel report partly a report about who sells the hero SKU fastest, because that is where the tallies are. Channels introducing customers to the premium line, bundles, or routines get structurally under-ranked even when they drive a disproportionate share of revenue. If your strategy involves migrating customers up the catalog, conversion counting actively measures against that strategy.
Where Revenue Attribution Breaks
Revenue weighting is the better default, but it has failure modes of its own, and pretending otherwise would repeat the original mistake of trusting a metric blindly.
The biggest is small-sample noise. Revenue concentrates: one €1,000 corporate gift order can swing a small channel's monthly revenue share dramatically without meaning anything. The lower a channel's order count, the wider the error bars on its revenue share, so read revenue-weighted reports over longer windows for small channels, and never re-budget off a single month's swing.
Returns, Discounts, and LTV Adjustments
Gross order value is not money you keep. Channels differ systematically in return rates (fashion driven by social hauls returns far more than replenishment driven by email), in discount depth (a channel that only converts with 25% codes is overstated by gross numbers), and in downstream value (a subscription first order understates the channel that sourced it, a problem that pulls toward customer lifetime value-weighted attribution as the next refinement). Each adjustment moves the number closer to economic truth and further from real-time availability, which is the trade-off to manage rather than solve.
Net vs Gross Revenue Attribution
In practice: start with gross revenue attribution because it is immediately available from your store data, then upgrade to net (after refunds and discounts) once your platform can sync refund events back into the attribution layer. The channels whose ranking changes between gross and net views are themselves a finding; that delta is your returns-and-discounts problem expressed in euros. Run the gross view for speed and the net view for budget decisions.
Setting Up Revenue Attribution in Practice
Operationally, revenue attribution requires three things from your stack, and most of the work is plumbing rather than analytics.
First, order values must flow into the attribution layer, which for Shopify brands means the attribution platform ingesting actual order revenue rather than firing a value-less conversion event. Second, the crediting model must distribute value, not counts: in a revenue attribution model, each touchpoint receives its share of the order's euros, so channel totals sum to actual revenue and reconcile against your store's books, a property worth testing explicitly when evaluating tools. Third, your attribution window has to be long enough to contain high-AOV journeys, because premium orders take longer to close and a short window amputates exactly the journeys revenue weighting is supposed to reveal; our attribution window guide covers how to set it.
Then recalibrate what you optimize. Replace CPA targets with channel-level ROAS (or POAS, profit on ad spend, if you have margin data), and review AOV per channel monthly so you notice when a channel's basket profile shifts. If you are comparing platforms on these capabilities, our marketing attribution software overview lists what to verify in a trial: revenue ingestion, refund handling, and whether reported channel revenue actually reconciles to your store.
Conclusion
Revenue attribution changes the unit of credit from "a conversion happened" to "this many euros happened," and for any store with variable AOV that change is not cosmetic. The worked example shows the stakes: the same month of orders ranks influencer as the worst channel by CPA and the largest revenue contributor by ROAS, with no change in underlying performance. Conversion counting systematically inflates volume channels, buries premium-AOV channels, and turns your reporting into a leaderboard for whoever sells the cheapest SKU fastest.
The takeaway: check your AOV spread per channel, and if it varies meaningfully (and for almost every DTC brand it does), stop ranking channels by conversion counts and CPA. Weight credit by revenue, mind the failure modes (small samples, returns, discounts), and let euros, not tallies, decide where next month's budget goes.
See how Kickbite attributes revenue, not just conversions → Get a Live Walkthrough
FAQ
How does revenue attribution differ from counting conversions? Revenue attribution divides each order's monetary value across its touchpoints, not a count of one. A €200 order spreads €200 of credit across its journey; a €40 order spreads €40. Channel reports then show euros contributed, which can be compared directly against euros spent.
What is the difference between revenue attribution and conversion attribution? Conversion attribution counts orders, treating every order as equal regardless of size. Revenue attribution weights each order by its value. The crediting model (last-click, linear, data-driven) can be identical in both; only the unit changes. The difference in reported channel performance grows with how much your order values vary.
Why does conversion-counted attribution mislead eCommerce brands? Because DTC order values are highly variable: single items, bundles, premium lines, and gift sets can span a 10x range. Counting conversions compresses that range to zero, which inflates channels driving many small orders and hides channels driving fewer large ones, pushing budget toward low-value volume.
Should I attribute gross or net revenue? Use gross for day-to-day reporting because it is immediate, and net (after refunds and discounts) for budget decisions. Channels differ systematically in return rates and discount depth, so the gross-to-net gap itself varies by channel and is worth monitoring as a metric.
Is revenue attribution the same as the revenue attribution in HubSpot or Salesforce? The principle is the same (tie revenue to marketing touches) but the context differs. CRM revenue attribution connects closed-won deal amounts to campaigns in a B2B pipeline. eCommerce revenue attribution weights order values across customer journey touchpoints, typically from Shopify or similar store data.
Does revenue attribution require a special tool? It requires your attribution layer to ingest order values and distribute them across touchpoints. GA4 reports conversion value, but with the auditability limits of its modeling. Dedicated attribution platforms built for eCommerce handle revenue ingestion, refunds, and journey-level breakdowns natively, which is the cleaner foundation.
Decisions start with trust
14-days for free