In the world of digital marketing, understanding how customers engage with your brand is crucial. Kickbites' attribution model sheds light on this journey, using the "touch, tell, sell" framework. This article explains the concept, starting with the basics.
Building the customer journey is the first and most important step. When your customer journeys are broken, even a data-driven attribution model can’t help. Our cookieless tracking system can map old touchpoints – for one customer, we traced a journey that started 499 days ago! We use fingerprinting, AI user matching, behavioral signals, and more. We keep updating to adapt to changes like those from IOS 14 or IOS 17.
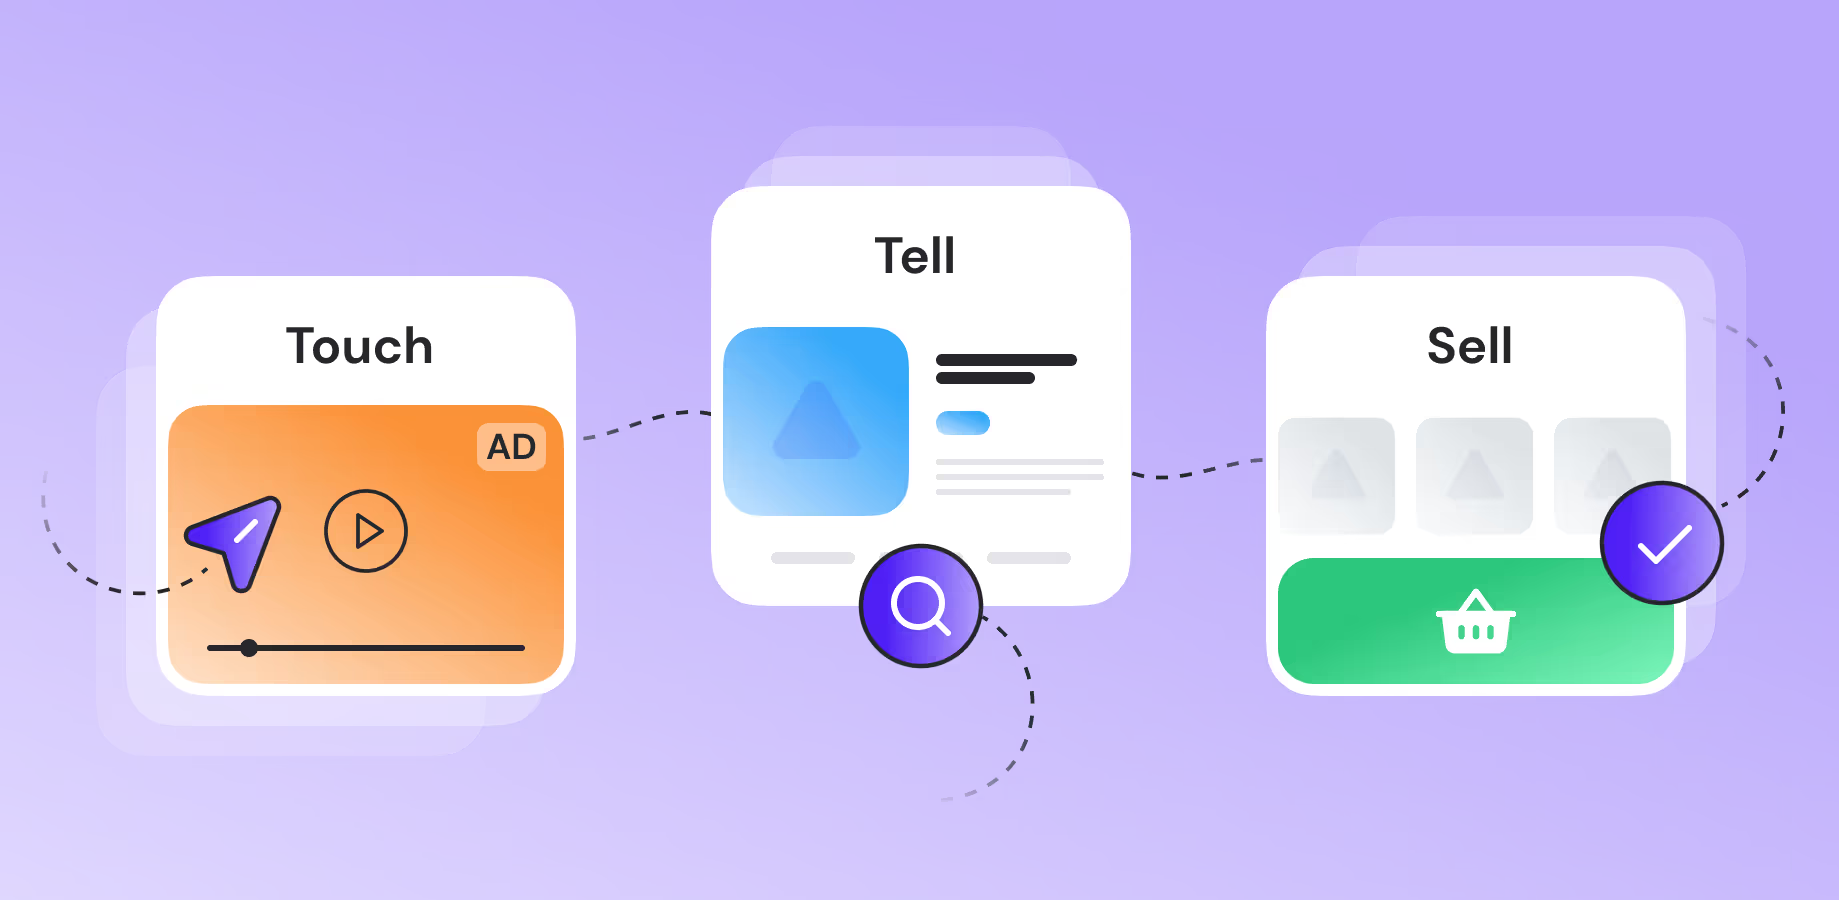
After mapping the customer journey, attribution comes into play. But before diving into details, let's understand the core concepts with a simple example of how the “Touch, Tell, Sell” framework works.

Think of this as the phase when a potential customer first notices your brand.

In this phase, users engage with the brand or product, and our tracking system determines if they progress to this stage based on various engagement metrics on your website.

The final destination is where the user decides to make a purchase. Specific actions are required to reach this stage, like initiating checkout, providing payment details, or buying the product.
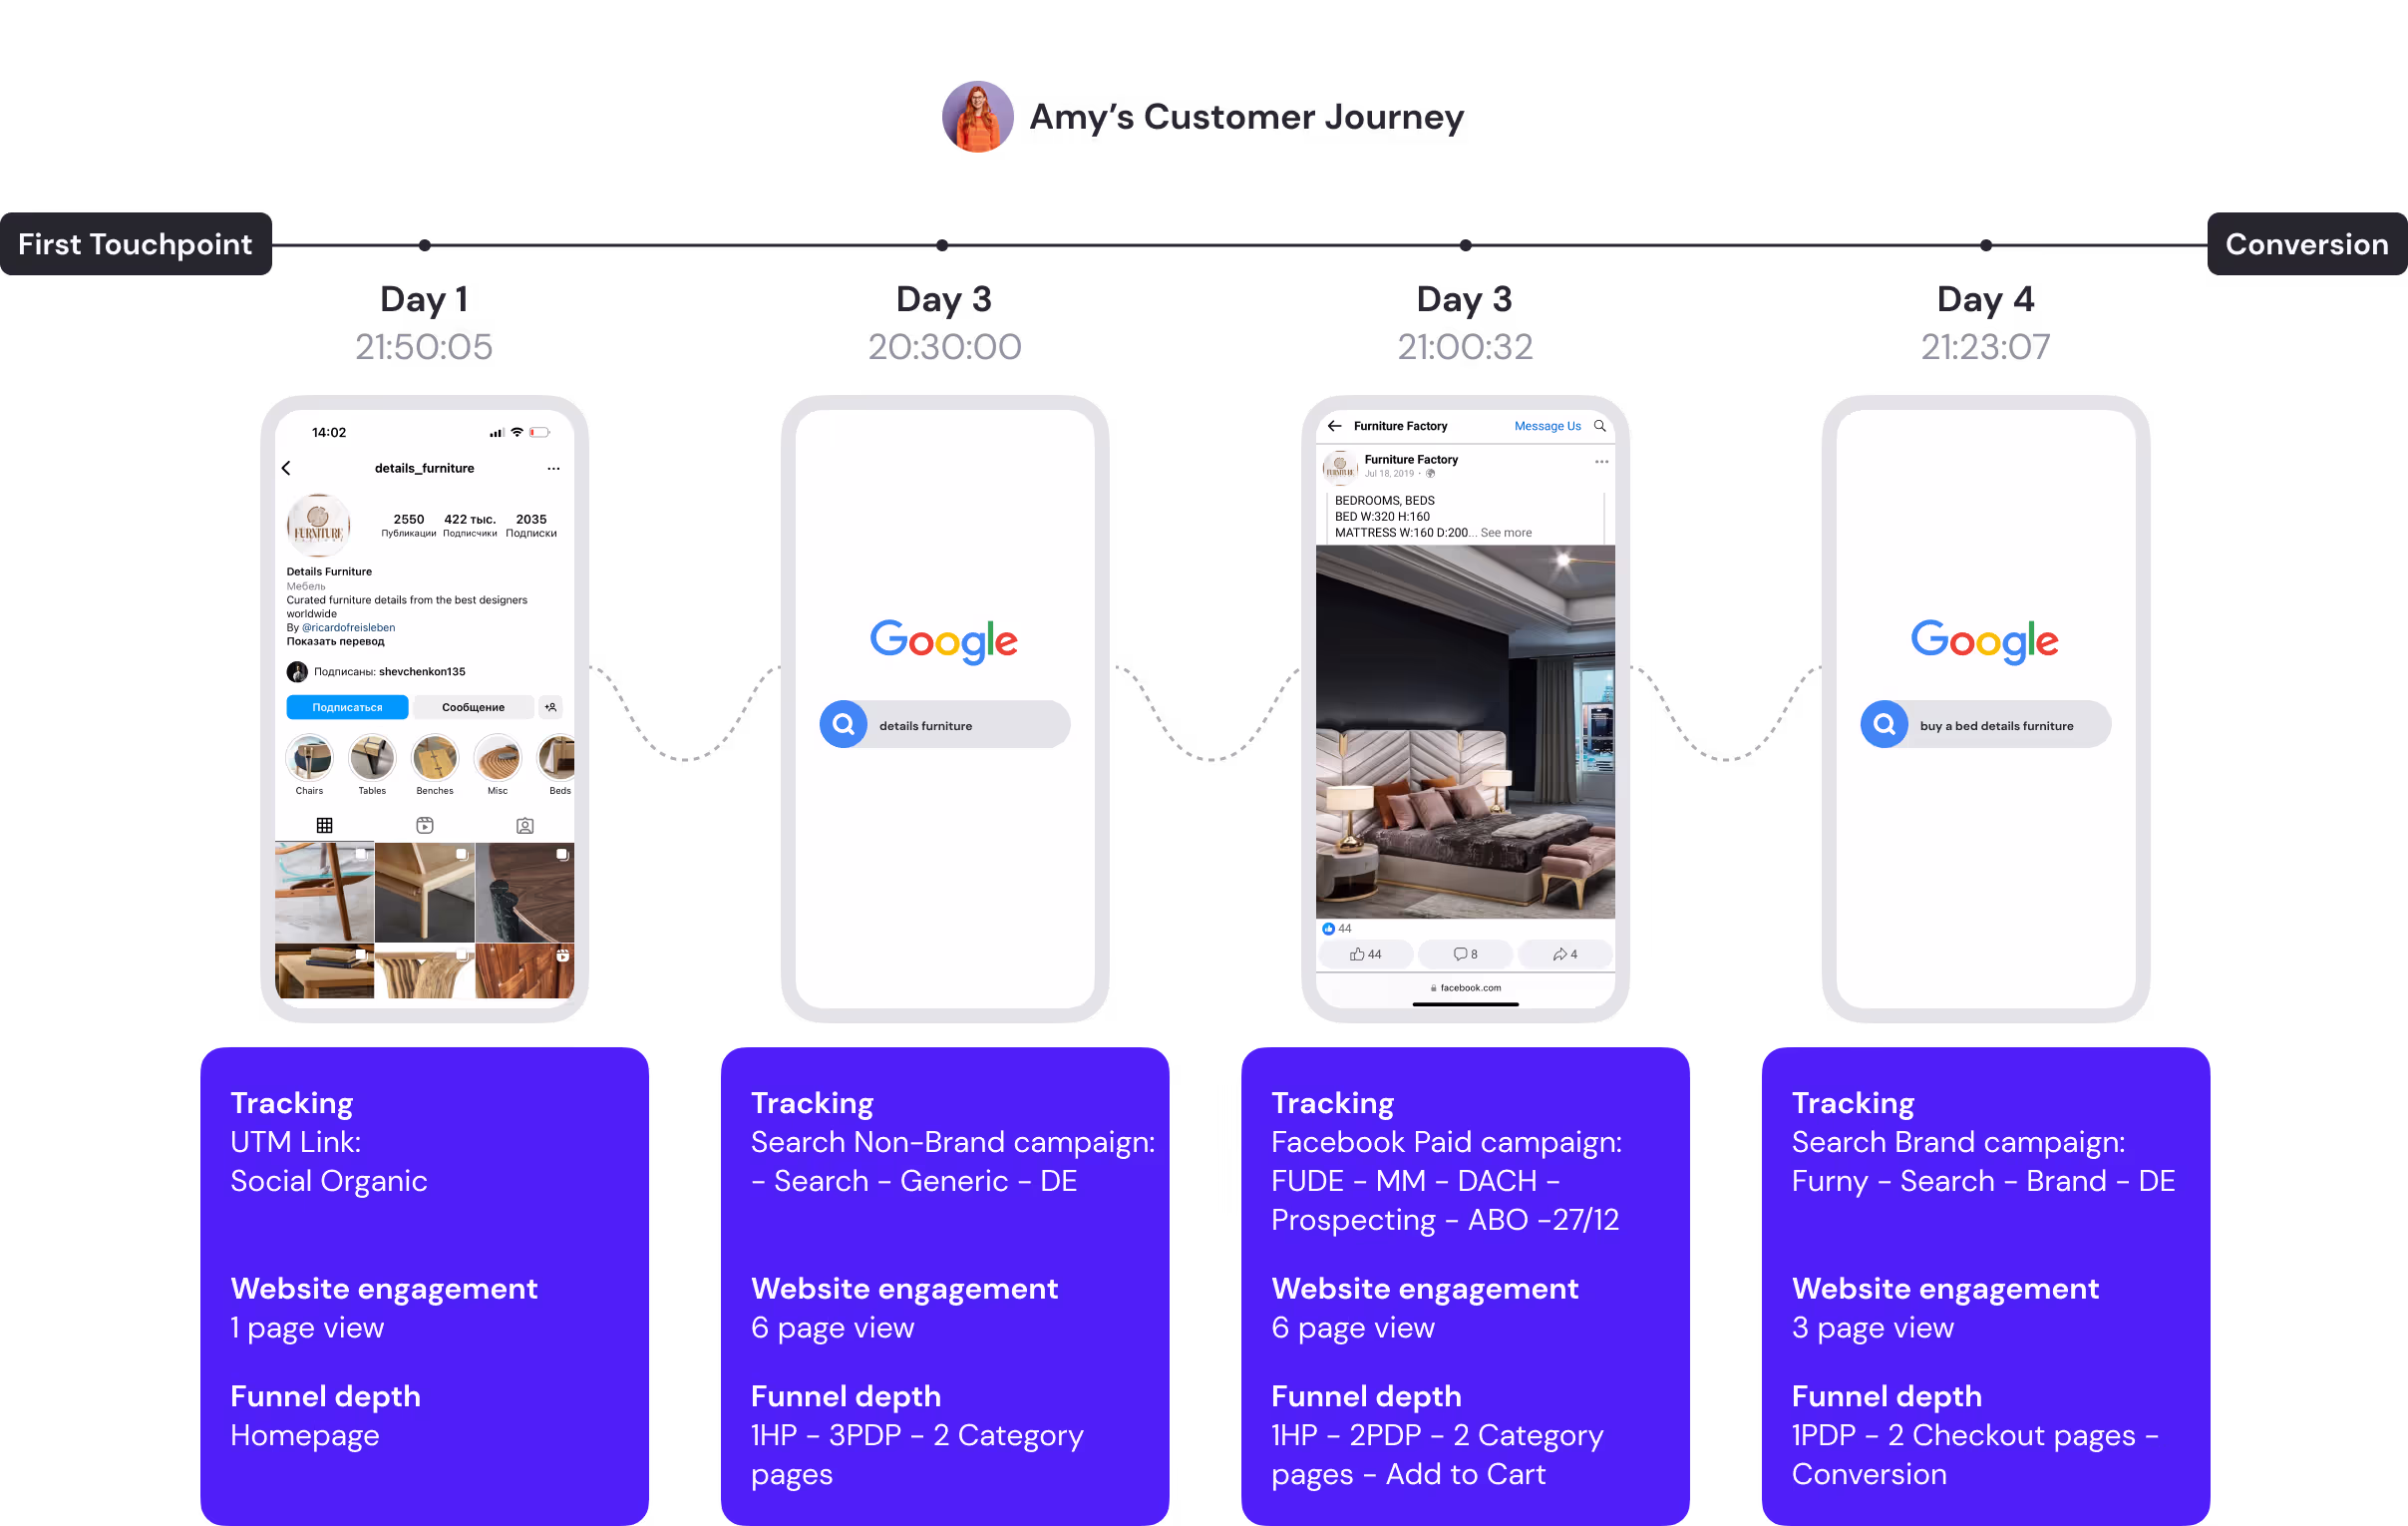
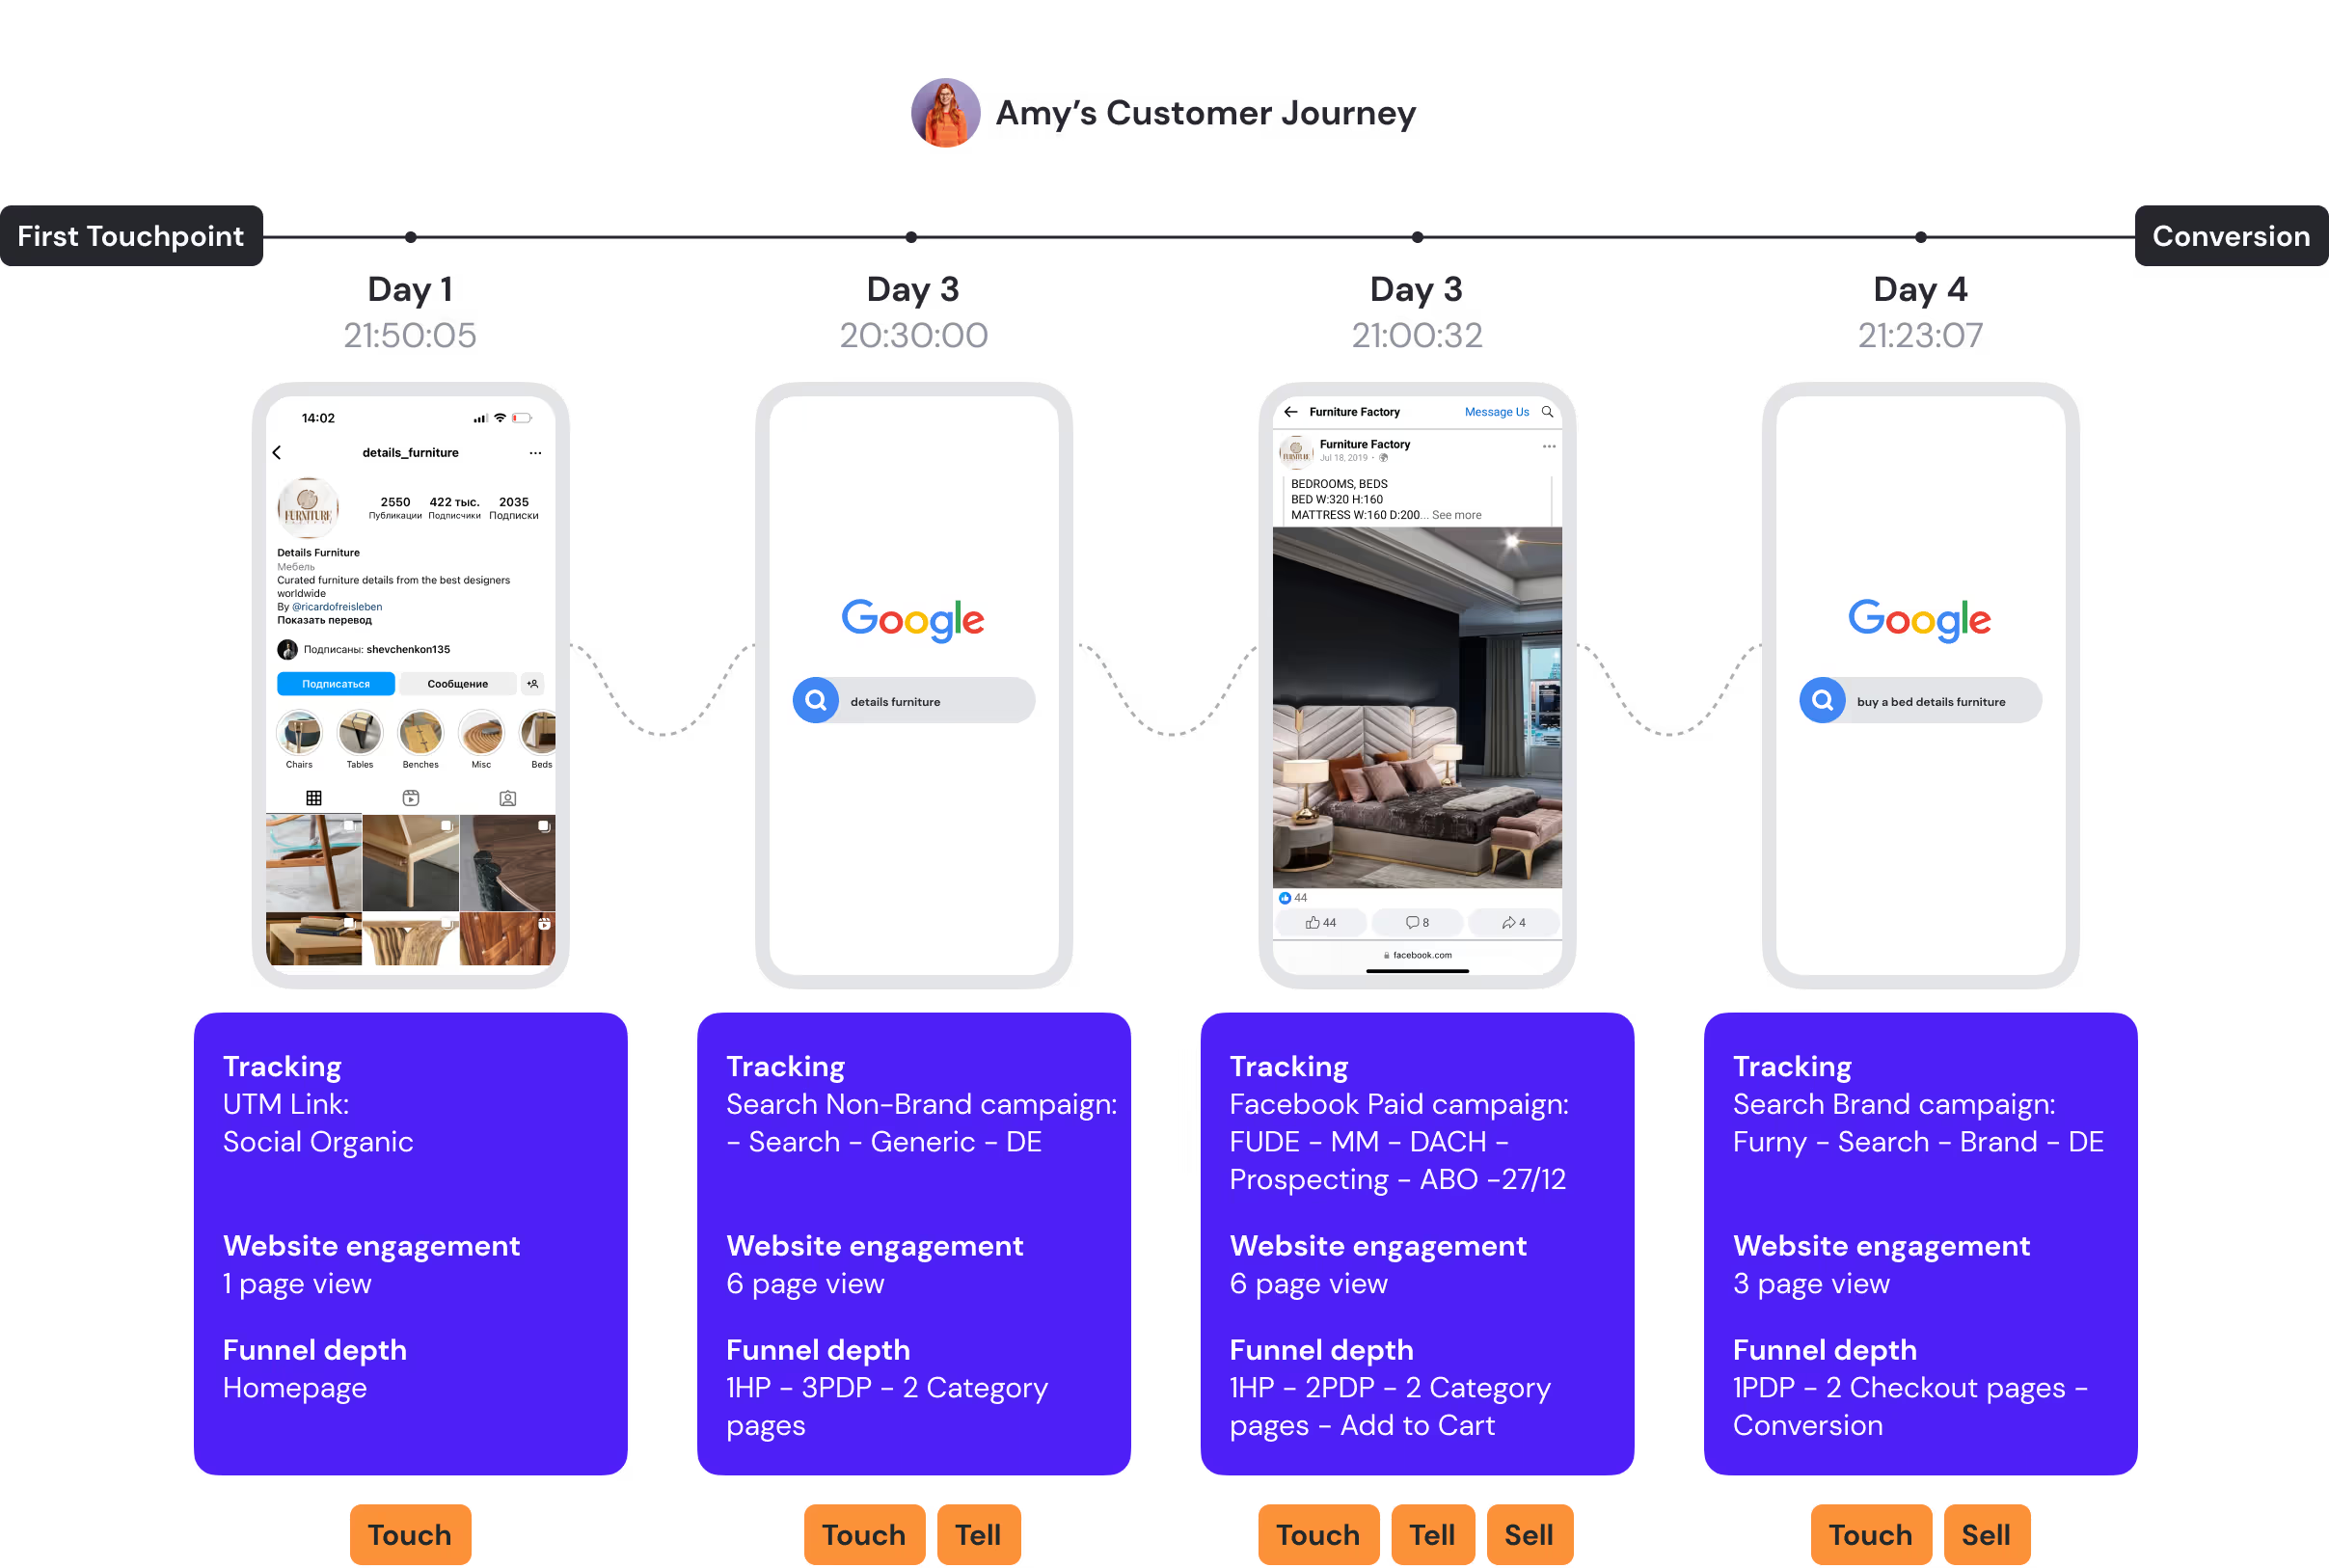
Real customer journeys are more complex than three touchpoints, making it a challenge to translate human behavior into numbers. That's where our algorithm excels.

The attribution model works in three steps:
Our algorithm uses data to classify touchpoints into each stage:
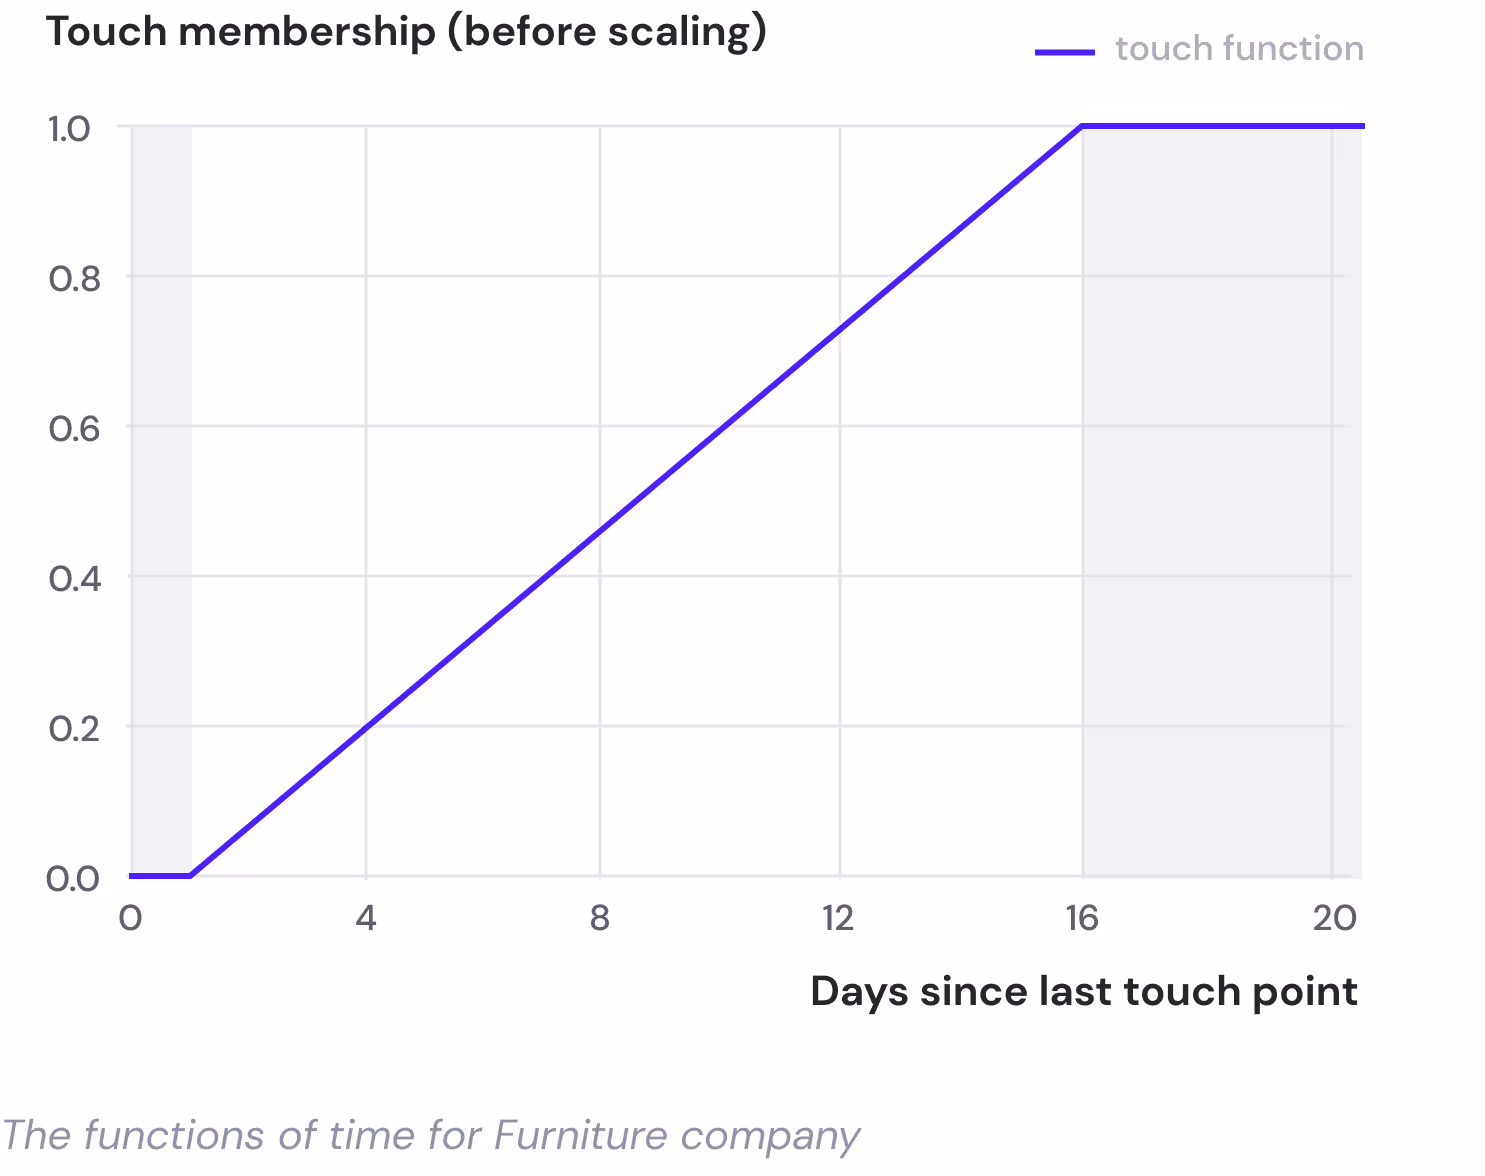
Each stage has different ways of evaluating touchpoints based on time. Only touchpoints classified are considered.
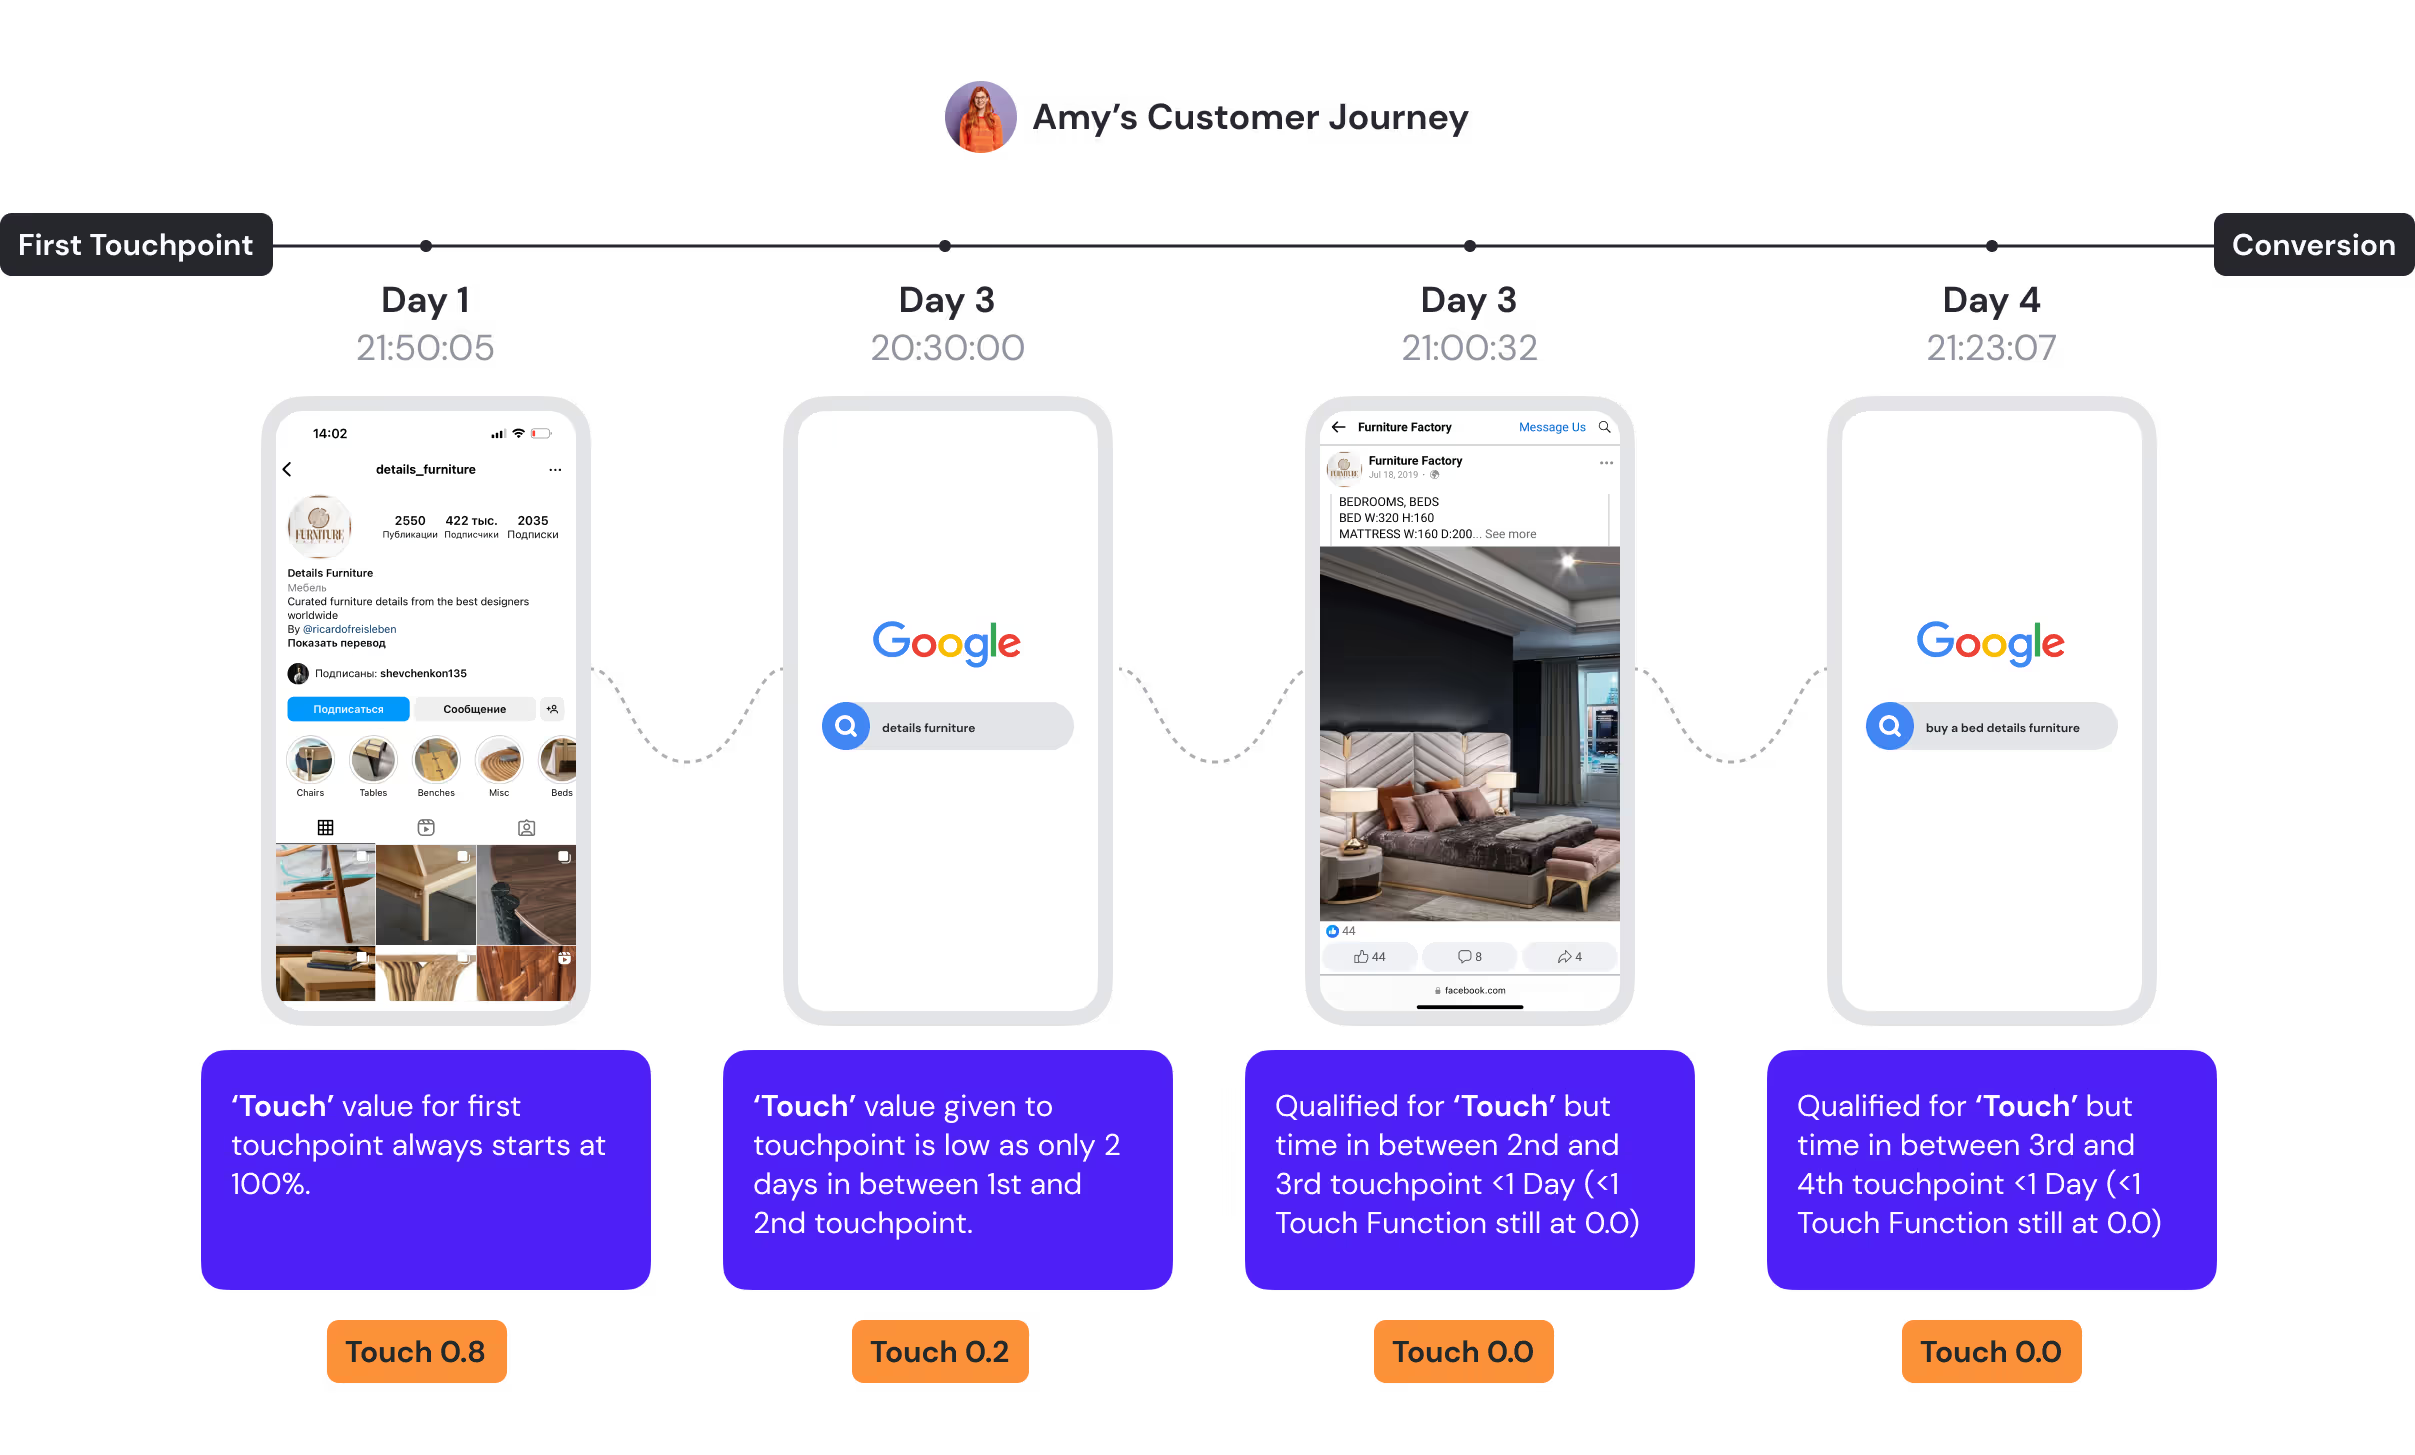
Here the main variable is time. The longer the time in between sessions the higher the Touch value for the follow up session. Why? That follow up session is reactivating again the attention from the user. A touchpoint only receives a value in “Touch” if days in between are more than 1.
The touch function always starts with 100% for the first touchpoint, then you evaluate the time with the next touchpoint. In this case, it was only 2 days after and based on the Touch function of time, the value will be “low”. Touch point 3 and 4 receive no value since the days in between are less than 1 day. After the respective computations the first touchpoint receives 0,8 of the touch phase and the second touchpoint 0,2.
The primary variable is time, but it follows a reverse function. This means that the session closer to conversions receives a higher "Sell" value.

From our example with Amy in the "Sell stage," we evaluate touchpoints 3 and 4. In this case, there was only one day between touchpoint three and four, indicating that Amy was already convinced to buy the product at the third touchpoint. After respective calculations, touchpoint 3 receives a value of 0.43 from the Sell Stage, while touchpoint four receives 0.57.
Despite being the second stage, we explain it last because it depends on the "Touch" and "Sell" Stage. The weighting for this stage does not follow a specific time-based function. Instead, it's computed for "Tell" during valid sessions between the "Touch" and "Sell" phases.
In our example, the second touchpoint has a high "Tell" weighting since the session has a low "Touch" value and is far from the conversion. For touchpoint three, the user is already very close to the conversion and in the "Sell" stage, resulting in a lower "Tell" fraction.
As a result, we determine the importance of each session or touchpoint in each of the stages. Here's an example for Amy:

The ultimate goal is to perform a final computation of attribution that maximizes revenue. The algorithm trains and identifies the ideal importance of each stage based on incremental principles using machine learning. We simulate what happens if each stage is removed for each brand. The importance of each stage varies for each brand, which is the main reason why our data requires several weeks of training in the onboarding process.
The basic idea is that if users find it hard to move to the next buying stage, that stage is very important. For example, if capturing a user's attention is easy for a brand due to product characteristics, but it struggles to convert them, then the sell phase is the most crucial. Campaigns that successfully address this phase will significantly impact total revenue.
In the case of the furniture brand from which Amy purchased her couch, the incrementality tests and machine learning algorithms determined that the "Touch" stage held the highest importance at 40%, followed by the "Tell" stage at 25%, and the "Sell" stage at 35%.
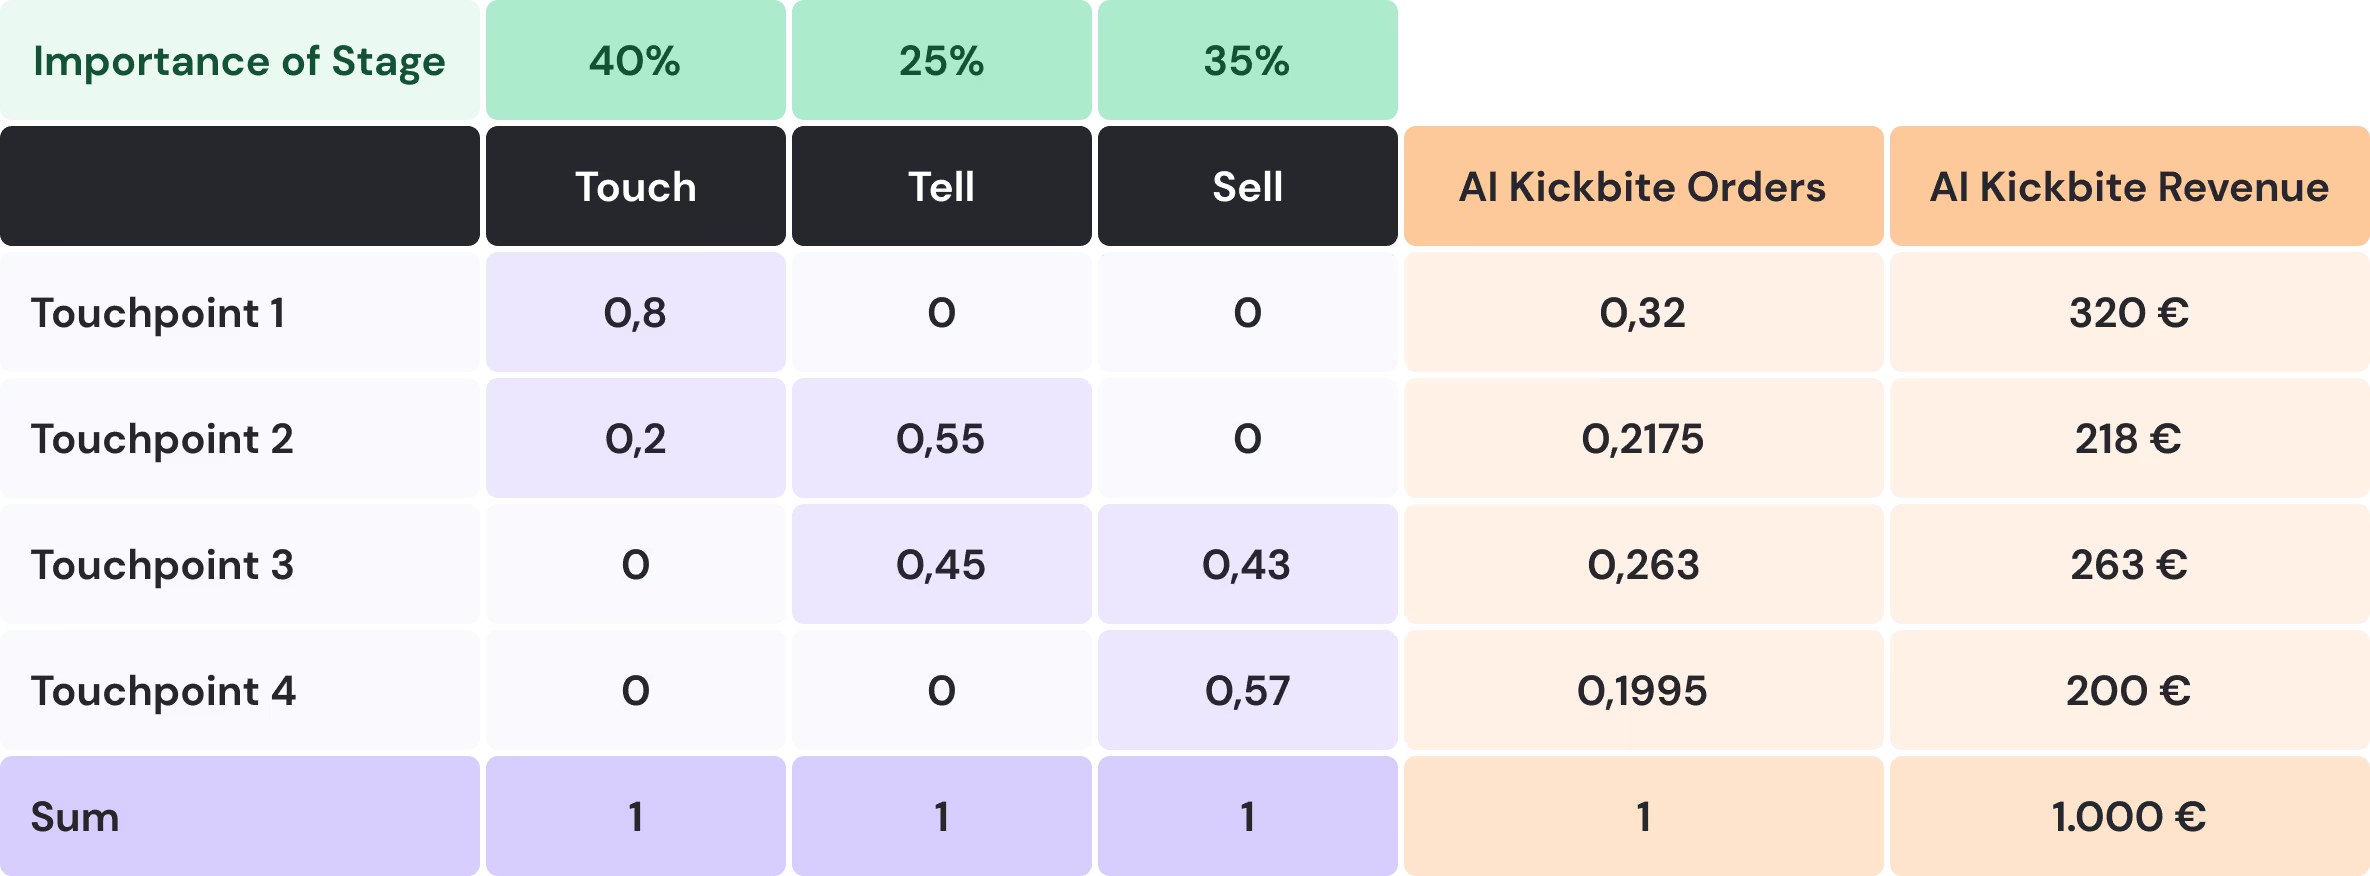
To calculate the final attribution per touchpoint, we multiply the weight of each touchpoint in each stage by the importance of the stage. The final step is to multiply this value by the order amount, in this case, 1,000 euros.
This process applies to all touchpoints and all conversions. The data is aggregated at all levels, such as the channel, campaign, or ad level. In Amy's example, the conversion was distributed among all touchpoints, but the first and third touchpoints were the most influential. The first touchpoint played the most significant role in the Touch Phase, which is the most critical phase for this particular brand. This makes sense, as furniture journeys are typically quite lengthy, and capturing attention early is crucial for conversion. On the other hand, the third touchpoint had a component of both 'tell' and 'sell.'
The "touch" and "sell" functions are presented as linear functions with default x and y values for the sake of simplicity. However, it's important to note that these functions vary for each brand. The relationship between x and y values changes depending on the brand's data. Furthermore, in reality, the function is not truly linear but rather curved.
The most important limitation is that the click model requires that the user goes to the website to participate in the attribution auction. To solve this we created the AI Click & Impression attribution. This model uses the same logic but on top uses stadistic modeling to quantify the impact of the view conversions from upper funnel channels.