Welcome to Kickbite. This guide aims to provide you with a comprehensive overview of Kickbite's technology, enabling you to start using the platform seamlessly.
We will split this article into two sections, technology and dashboard features. Technology section will explain everything behind the hood, while features focus more on the user experience on the dashboards.
Third-party cookies have long been the backbone of online advertising, allowing advertisers to measure the success of their campaigns and improve targeting. However, in recent years, reliance on third-party cookies has decreased due to changes in user behavior (e.g., installing ad-blocking software) and new privacy features in browsers.
One notable example is Safari's Intelligent Tracking Prevention (ITP). But Apple is not alone in this; Mozilla has been leading the way with their Enhanced Tracking Prevention (ETP), and with each new browser release, they strengthen their privacy prevention methods. As a result, ITP and ETP not only impact third-party cookies (which they block by default) but also place restrictions on first-party cookies.
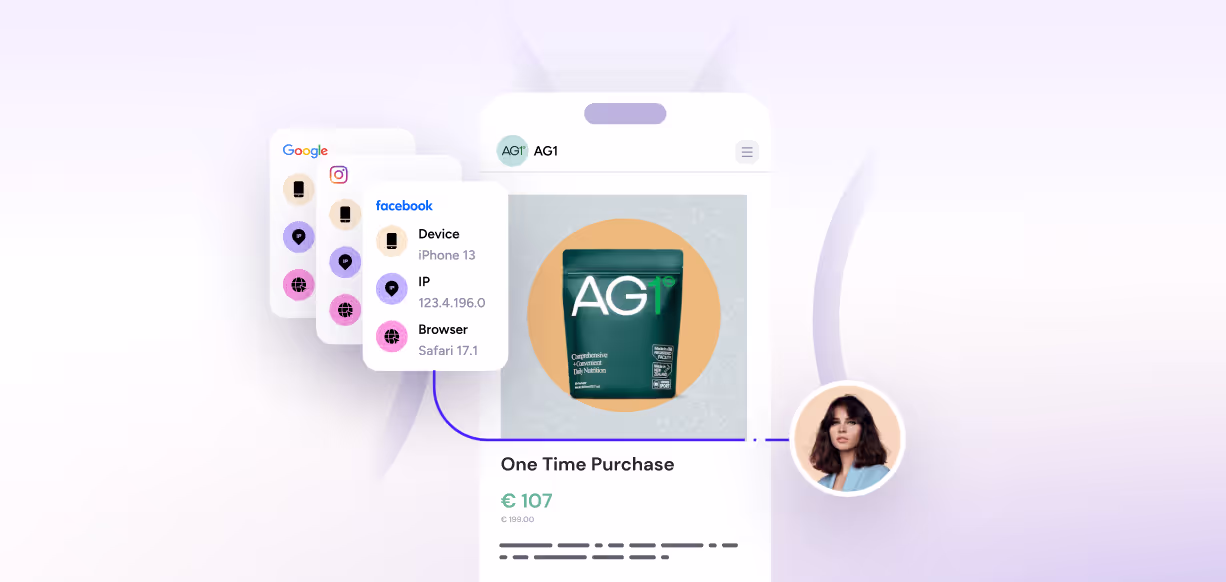
Consequently, Kickbite decided to forgo cookies entirely from the start, using a mix of non-cookie-based tracking methods. This enables Kickbite to track customer journeys 31% longer than GA4. Here is a brief overview of the tracking methods used by Kickbite:
After constructing customer journeys, we determine which touchpoint holds the most value. Each website touchpoint is connected with Kickbite URL parameters or UTMs, allowing us to identify the channel, campaign, ad group, and ad.
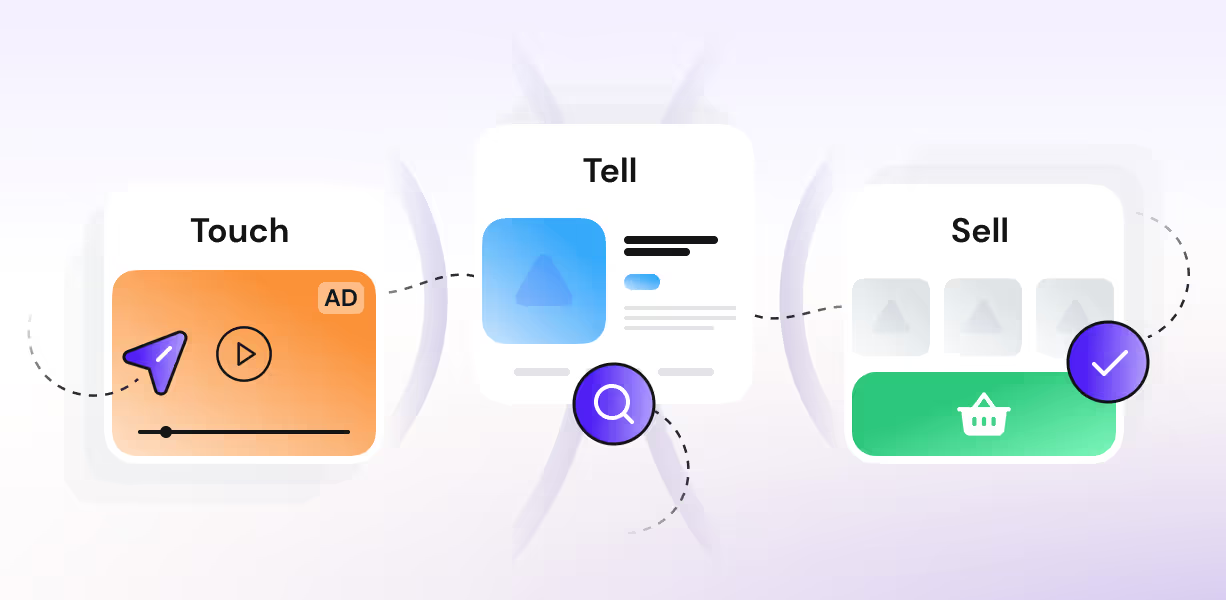
The Kickbite attribution model analyzes human behavior using the touch, tell, sell framework, aiming to provide an unbiased source of truth that closely mirrors reality.
Each touchpoint is evaluated based on its position in the customer journey and the user's engagement within that journey. We use incrementality principles to assign higher value to touchpoints crucial for purchase. This principle enhances your return on investment when optimizing your channel budget, campaigns, and ads.
In Kickbite dashboards, there are two options: AI Click and AI Click & Impressions. Our latest innovation accounts for the impact of impression conversions on your channel mix, ensuring your top funnel channels get in average 5 times more revenue than GA4.
After defining the revenue per channel, campaign, and ad based on Kickbite's cookie-less tracking and AI attribution, we enrich the data with two main sources: shop system data and data from all marketing platforms.
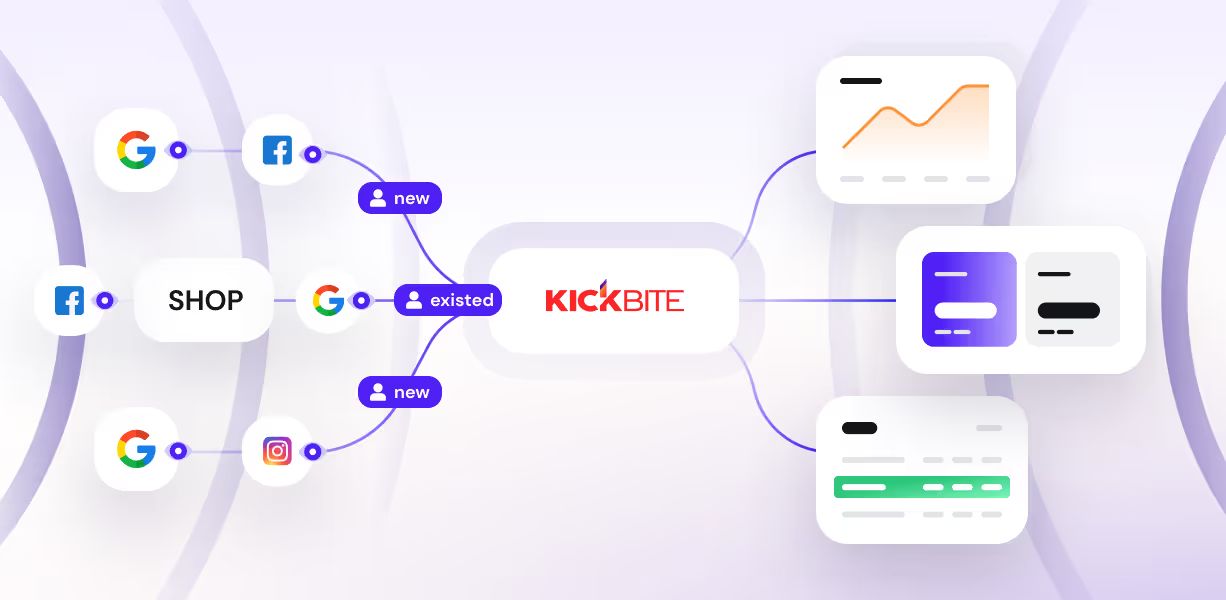
We utilize your shop system data for two key purposes: firstly, to ensure that the data we report aligns precisely with your internal numbers, and secondly, to distinguish between new and returning customers. During the data cleaning process, we consider only the order statuses defined in the onboarding phase, typically excluding canceled and draft orders.
These details can be verified within the Account Information section in your settings. For identifying new and existing customers, we rely on the hashed email addresses of the buyers. If an email is already present in our database, we categorize them as a returning customer.
From the marketing platforms, we extract all relevant costs, along with special KPIs such as impressions and clicks. We then synthesize all this information to provide a comprehensive overview on our dashboards.
The Kickbite Platfform is designed to provide a powerful analytics experience tailored to different stakeholders. We offer three main analytic dashboards, each crafted to cater to specific roles within your organization. These dashboars arm you with the essential tools you need for data-driven decision-making:
Keep your entire company on the same page by receiving daily or 7 a.m. reports with essential business metrics, right in your inbox.
In addition to the core views, we're introducing some key add-ons that will elevate your analytics game:
Have you ever wished for? Sidekick AI is the offspring of Kickbite and ChatGPT, combining the unparalleled data quality of Kickbite with the advantages of generative AI.
Profitability on Ad Spend (POAS) is an advanced KPI that offers a more accurate measure of advertising success than traditional Return on Ad Spend (ROAS). While ROAS only tracks revenue per advertising dollar, POAS considers both revenue and the costs associated with sold products, providing a true reflection of financial impact. This shift from revenue to profitability ensures your advertising strategies are not just driving sales, but also enhancing your bottom line.
In summary, Kickbite redefines digital marketing analytics with its innovative cookie-less tracking and AI attribution. It offers precise insights into customer behavior and ad effectiveness. Our user-friendly dashboards are tailored for various team roles, providing essential data for informed decision-making. With unique features like Profitability on Ad Spend (POAS), Kickbite goes beyond traditional metrics, ensuring your marketing strategies contribute positively to your bottom line.